
Image
|
Figure Caption
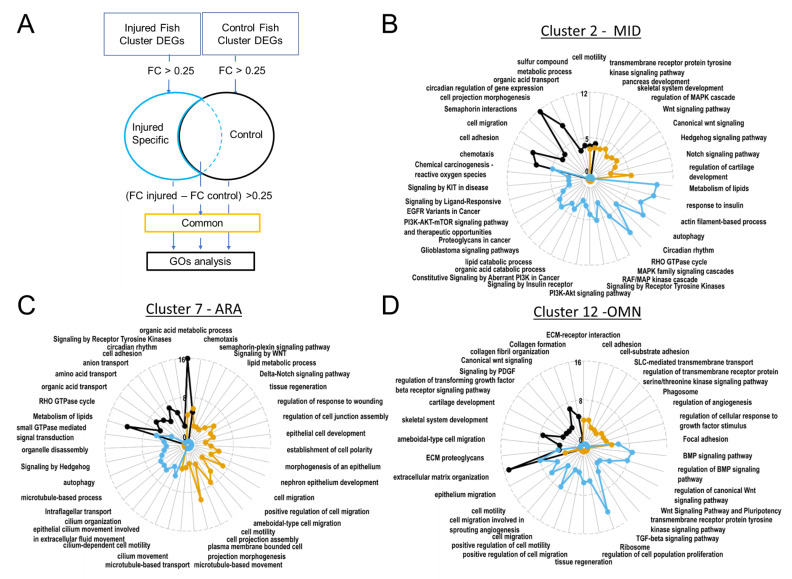
Fig. 7
Gene ontology revealed upregulated biological processes. In ARA gene lists corresponding to genes specifically present in samples from injured fish, cilium-dependent cell motility GO and other cilium associated GOs are enriched. (A). Pipeline for filtering DEGs for GO analyses with Metascape. Radarplots of enriched Gene ontologies. Curves colored following types of filtering as explained in (A). Axis concern Zscore of GOs. Increased distance from the centre means higher significance. (B). OMN. (C). MID. (D). ARA.
Acknowledgments
This image is the copyrighted work of the attributed author or publisher, and
ZFIN has permission only to display this image to its users.
Additional permissions should be obtained from the applicable author or publisher of the image.
Full text @ Cells