
|
Fig. 5
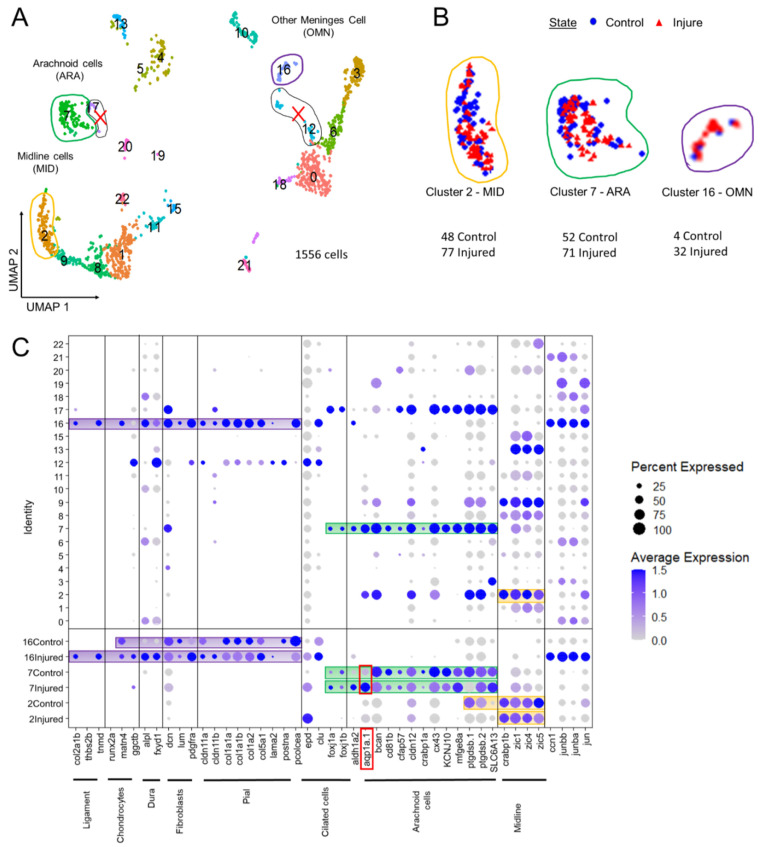
Analysis of scRNAseq data highlight cell heterogeneity of GFP cells from dissected tectum of PDGFRβ-gal4;UAS: EGFP in 21 dpf injured fish and 21 dpf control fish. (A). Uniform manifold approximation and projection (UMAP) showing cell populations from 21 dpf control and injured fish. The projection was computed from the twenty first principal component analyses of gene expressions. Each point represents a single cell with a colour indicating its membership to a cluster. (B). UMAP of injured and control cells colored according to their sample types (blue circle for control fish and red triangle for injured fish). Approximately equal numbers of cells of each origin was observed in most clusters. This avoided batch effect. (C). Cluster analysis of characteristic DEGs from different cell populations including arachnoid cells (ARA) found in cluster 7, midline-like cells (MID) found in cluster 2 and other meninx cells (OMN) found in cluster 16. Cluster 17 et 12 contained DEGs similar to clusters 2, 7, 16 but these clusters were discarded from our analysis due to their small size and heterogeneity.