
|
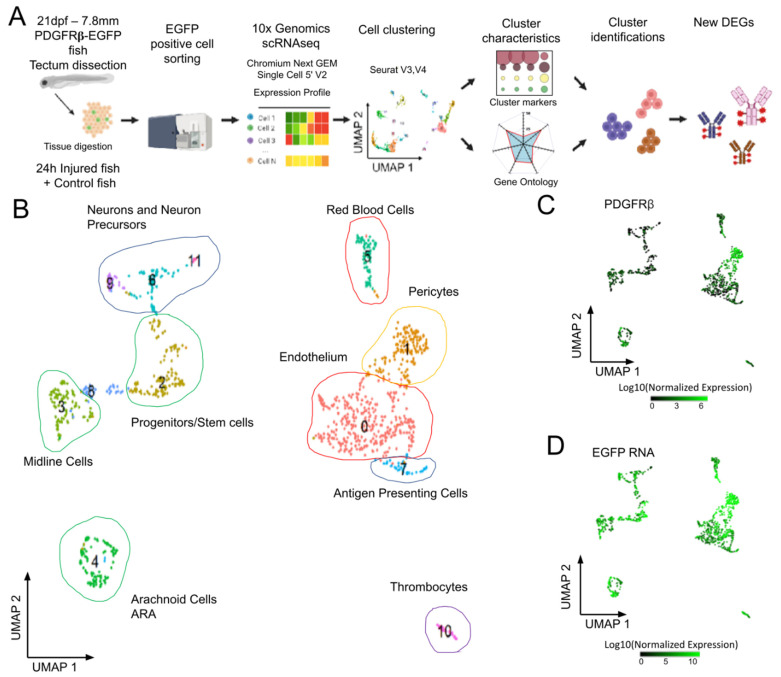
Fig. 2
Analysis of scRNAseq data highlights cell heterogeneity of GFP positive cells from dissected tecta of PDGFRβ-gal4:UAS-EGFP juveniles. (A). Experimental workflow for the collection and isolation of OT cells. (B). Uniform manifold approximation and projection (UMAP) showing cell populations from control 21 dpf juveniles. The projection was performed with the 30 first principal component analysis of gene expression. Each point represents a single cell with a colour indicating its membership to a cluster. 0: KDRL- Endothelium; 1: NDUFA.4L2A-Pericyte; 2: RPS2-Progenitors, Stem cells; 3: ZIC4- Midline Cells; 4: AQP1A.1-Arachnoid Cells; 5: HBAA1-Red Blood Cells; 6: ELAVL4- Neurogenic Precursors; 7: CD74A-Antigen Presenting Cells; 8: Uncharacterized; 9: NEUROD1- Neurons and Precursors; 10: THBS1B- Thrombocytes; 11: HPCA- Neurons. (C). Featureplot highlighting PDGFRβ transcript levels in cells. (D). Featureplot of GFP transcript levels. PDGFRβ expression is correlated to GFP showing that most GFP+ cells express PDGFRβ.