
|
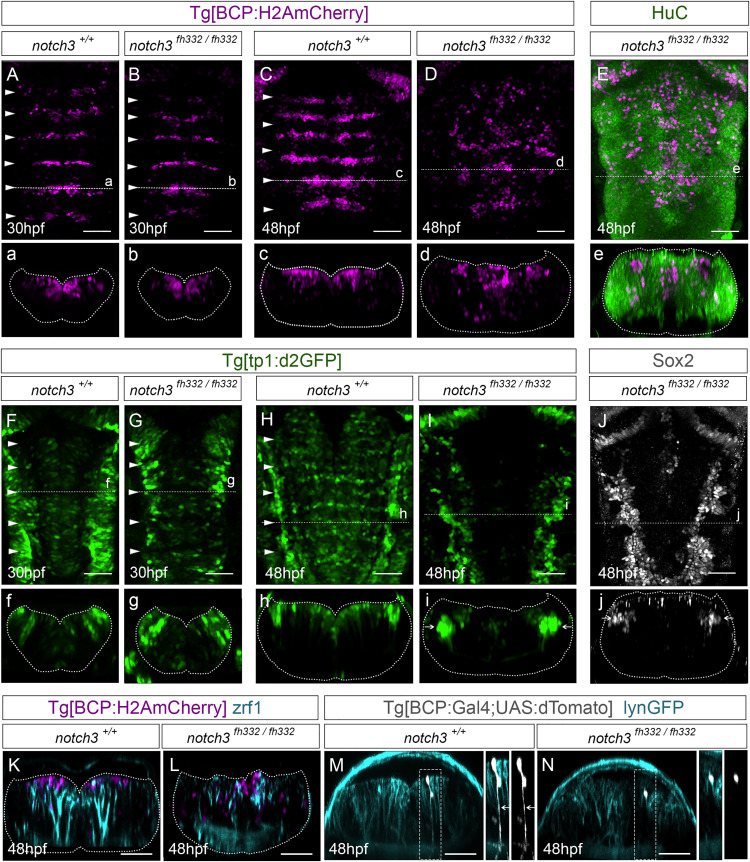
Fig. 6 Figure 6. Notch3 is crucial for maintaining boundary cells as radial glia progenitors (A–J) Tg[BCP:H2AmCherry;notch3+/+] and Tg[BCP:H2AmCherry;notch3fh332/fh332] embryos were used for the analysis of the (A–D) position of boundary cells and their derivatives (36 hpf, notch3+/+ n = 6/6 embryos versus notch3fh332/fh332 n = 6/6 embryos; 48 hpf, notch3+/+ n = 8/8 embryos versus notch3fh332/fh332 n = 8/8 embryos), (E) differentiated neurons (n = 7/7 embryos), (F–I) Notch-activity (30 hpf, notch3+/+ n = 7/7 embryos versus notch3fh332/fh332 n = 7/7 embryos; 48 hpf, notch3+/+ n = 4/4 embryos versus notch3fh332/fh332 n = 4/4 embryos), and (J) neural progenitor cells (n = 7/7 embryos). Dorsal (A–J) and transverse (a–j) views of the indicated boundary (dashed line). (K–L) Transverse views from Tg[BCP:H2AmCherry;notch3+/+] and Tg[BCP:H2AmCherry;notch3fh332/fh332] embryos labeled with zrf1 (notch3+/+ n = 5/5 embryos; notch3fh332/fh332 n = 7/7 embryos). (M–N) Clonal analysis of radial glia morphology of boundary progenitors. Transverse views of Tg[BCP:Gal4;notch3+/+] and Tg[BCP:Gal4;notch3fh332/fh332] embryos showing plasma membranes in cyan and boundary cell nuclei in white. Note that upon notch3 mutation boundary cells lose the radial glia projection (see inserts). BCP, boundary cell population; hpf, hours post-fertilization. Scale bar, 50 μm.