
Image
|
Figure Caption
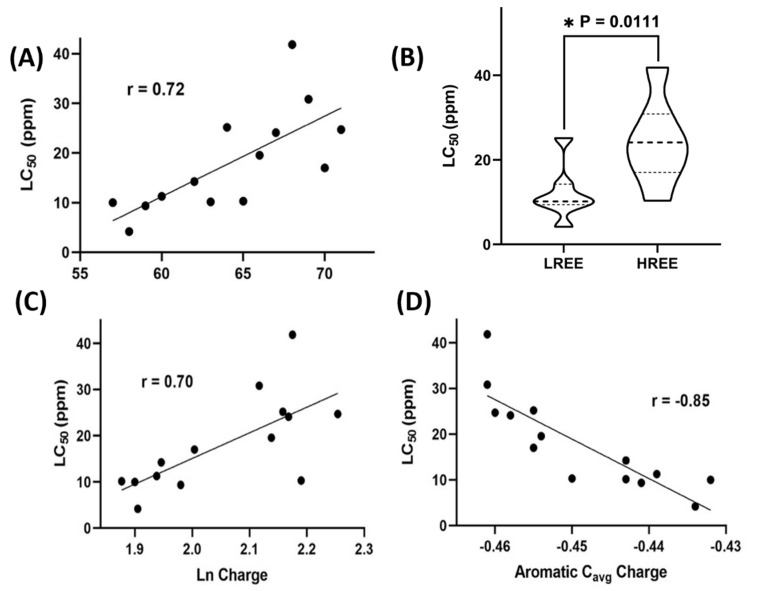
Fig. 4
Correlations of properties of the Lanthanides complexes to the acute toxicity of fourteen Lanthanides. (A) The linear regression analysis showed a significant correlation between LC50 and Lanthanide’s atomic numbers with r = 0.72. (B) A violin plot shows a statistical difference between the two LC50 of LREE and HREE (p = 0.0111). (C) The linear regression analysis showed a significant correlation between LC50 and Lanthanide’s Milliken charge with r = 0.70. (D) The linear regression analysis showed the most significant correlation between LC50 and the aromatic Cavg charge with r = −0.85.
Acknowledgments
This image is the copyrighted work of the attributed author or publisher, and
ZFIN has permission only to display this image to its users.
Additional permissions should be obtained from the applicable author or publisher of the image.
Full text @ Toxics