
Image
|
Figure Caption
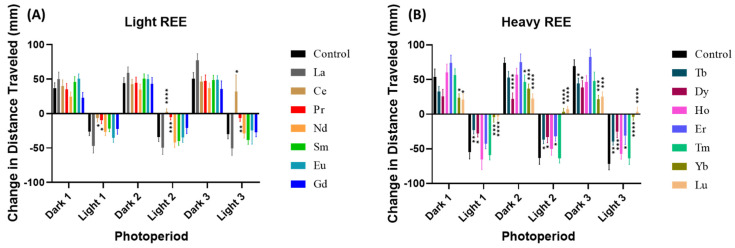
Fig. 3
The photo motor response (PMR) of zebrafish after 96 h exposure to 1 ppm of (A) light REE and (B) heavy REE. The data are expressed as mean ± SEM and statistical differences were analyzed by two-way ANOVA followed with Fisher’s LSD test (* p < 0.05, ** p < 0.01, *** p < 0.001, **** p < 0.0001).
Acknowledgments
This image is the copyrighted work of the attributed author or publisher, and
ZFIN has permission only to display this image to its users.
Additional permissions should be obtained from the applicable author or publisher of the image.
Full text @ Toxics