
Image
|
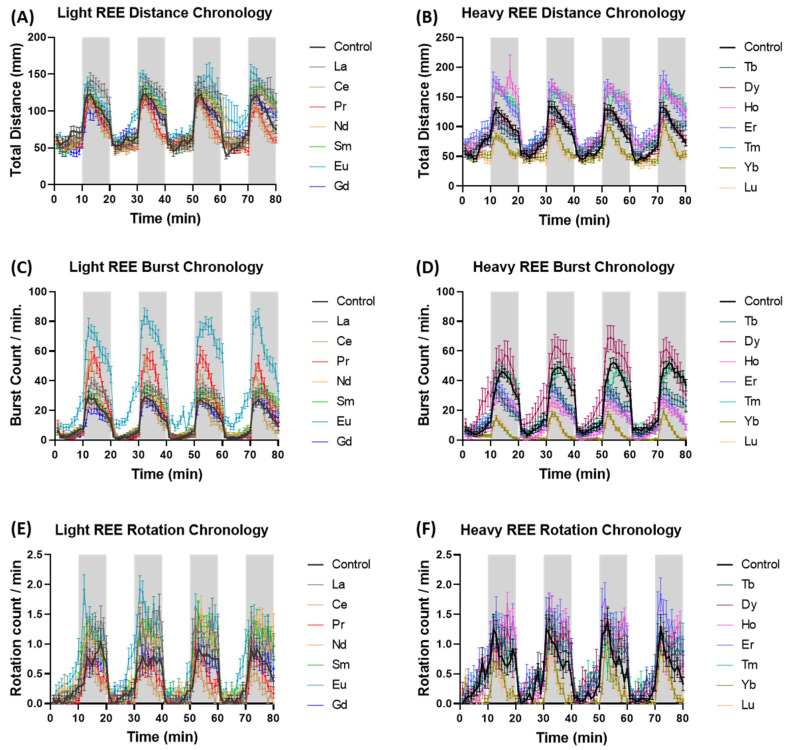
Figure Caption
Fig. 2
Swimming activity of zebrafish after exposure to different Lanthanides. The mean ± SEM of (A,B) distance traveled, (C,D) burst movement, and (E,F) rotation counts per minute by zebrafish larvae after 24 h exposure of 1 ppm LREE and HREE during both light and dark cycles. A two-way ANOVA test with Geisser-Greenhouse’s correction continued with Dunnett’s multiple comparisons test was carried out to compare all treatments with the control (presented in Table S2).
Acknowledgments
This image is the copyrighted work of the attributed author or publisher, and
ZFIN has permission only to display this image to its users.
Additional permissions should be obtained from the applicable author or publisher of the image.
Full text @ Toxics