
Image
|
Figure Caption
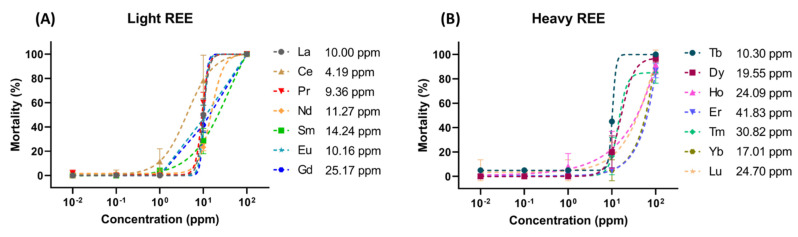
Fig. 1
LC50 of zebrafish embryos exposed to actual concentrations (ppm) of (A) Lanthanide’s light REE and (B) Lanthanide’s heavy REE for 96 h. The 96 h LC50 values were calculated by using the sigmoid curve fitting method and the data are expressed as mean ± SEM.
Acknowledgments
This image is the copyrighted work of the attributed author or publisher, and
ZFIN has permission only to display this image to its users.
Additional permissions should be obtained from the applicable author or publisher of the image.
Full text @ Toxics