
|
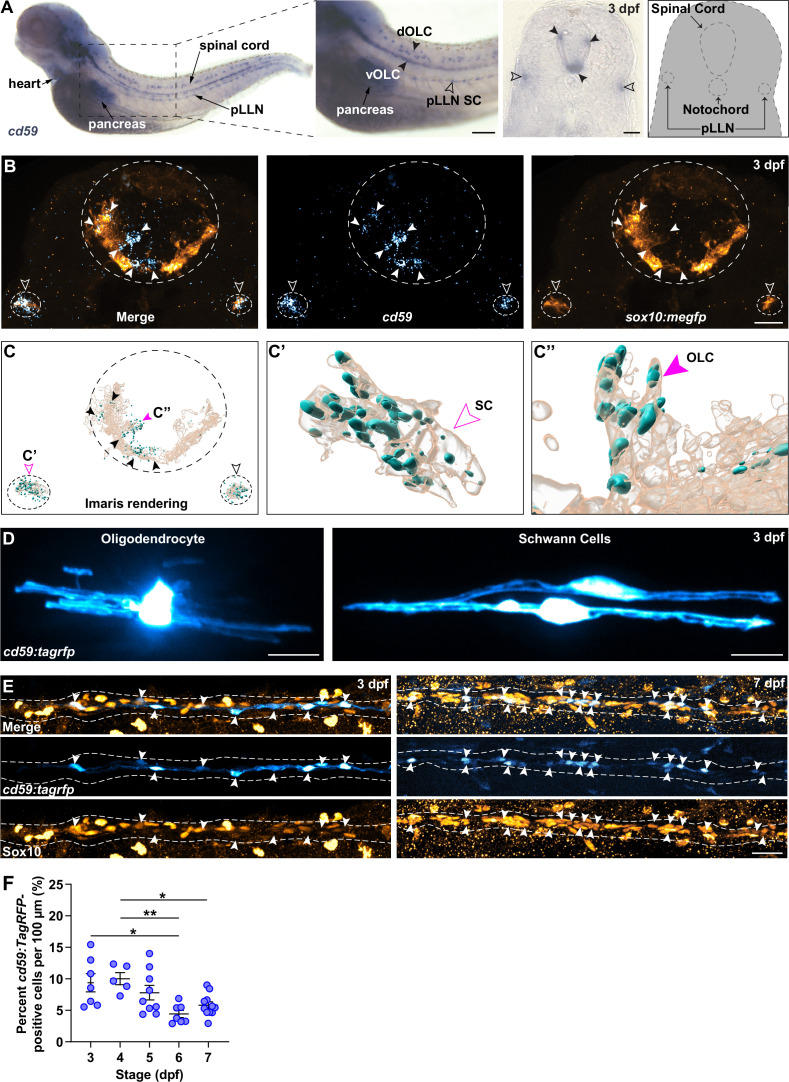
Fig. 2
(A) Bright-field images of whole-mount chromogenic in situ hybridization (CISH) showing cd59 expression (purple) in the heart, pancreas, dorsal and ventral oligodendrocyte lineage cells (OLCs) (dOLCs and vOLCs, respectively; filled arrows), and posterior lateral line nerve (pLLN) SCs (empty arrows) at 3 days post fertilization (dpf). Schematic (right panel) indicates location of spinal cord, notochord, and pLLN in transverse section. (B) Fluorescent in situ hybridization (FISH) (RNAscope; ACD) showing cd59 expression (cyan) in sox10:megfp-positive, pLLN SCs (cd59-positive orange cells indicated by empty arrows), and spinal cord OLs (cd59-positive orange cells indicated by filled arrows) at 3 dpf in transverse sections (top row). Representative image (top row) displays one SC on each pLLN (left and right empty arrows) as well as multiple OLs in the spinal cord (filled arrows). Images were acquired with confocal imaging. (C) Imaris renderings of the confocal images shown in (B), including the full image (left panel). From the full image (left panel, C), a single SC (indicated with the open magenta arrow and enlarged in the middle panel, C’) and a single OLC (indicated with the filled magenta arrow and enlarged in the right panel, C’’) illustrate the cd59 puncta localized within the myelinating cells. (D) Mosaic labeling showing a cd59:tagrfp-positive OL in the spinal cord (left) and two SCs on the pLLN (right) at 3 dpf. (E) Immunofluorescence (IF) showing cd59:tagrfp expression (cyan) in Sox10-positive SCs (orange) along the pLLN at 3 and 7 dpf (left and right panels, respectively). Double-positive cells are indicated with white arrows. White dashed lines outline the pLLN. Sox10-positive pigment cells outside of the dashed lines were not included in the analysis. (F) Scatter plot of percent cd59:tagrfp-positive SCs on the pLLN from 3 to 7 dpf (mean ± SEM: 3 dpf: 9.4 ± 1.5; 4 dpf: 10.0 ± 1.0; 5 dpf: 7.8 ± 1.2; 6 dpf: 4.4 ± 0.6; 7 dpf: 5.8± 0 .6; p-values: 3 vs. 6 dpf: p=0.0126, 4 vs. 6 dpf: p=0.0095, 4 vs. 7 dpf: Pp0.0477; dot = 1 fish). Data collected from somites 11–13 (~320 µm) and normalized to units per 100 µm. These data were compared with a one-way ANOVA with Tukey’s post-hoc test using GraphPad Prism. All fluorescent images were acquired with confocal imaging. Scale bars: (A) lateral view, 100 µm; transverse section, 25 µm; (B, D) 10 µm; (E) 25 µm. Artwork created by Ashtyn T. Wiltbank with Illustrator (Adobe).