
Image
|
Figure Caption
Fig. 3
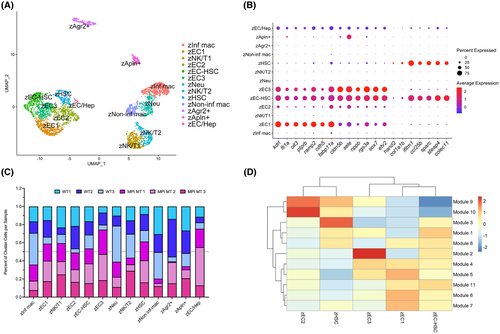
Characterization of zebrafish HSCs and ECs. (A) UMAP visualization of 13 clusters comprised of WT and mpi+/mss7 adult zebrafish liver cells subset from total liver cell clustering. (B) Dot plot of gene expression for top DEGs in clusters zEC1, zEC2, zEC3, zEC-HSC, and zHSC. (C) Bar graph showing the percentage of cells contributed to each cluster from each sample. (D) Heatmap showing expression of modules of coregulated genes correlating with EC and HSC clusters
Acknowledgments
This image is the copyrighted work of the attributed author or publisher, and
ZFIN has permission only to display this image to its users.
Additional permissions should be obtained from the applicable author or publisher of the image.
Full text @ Hepatol Commun