
|
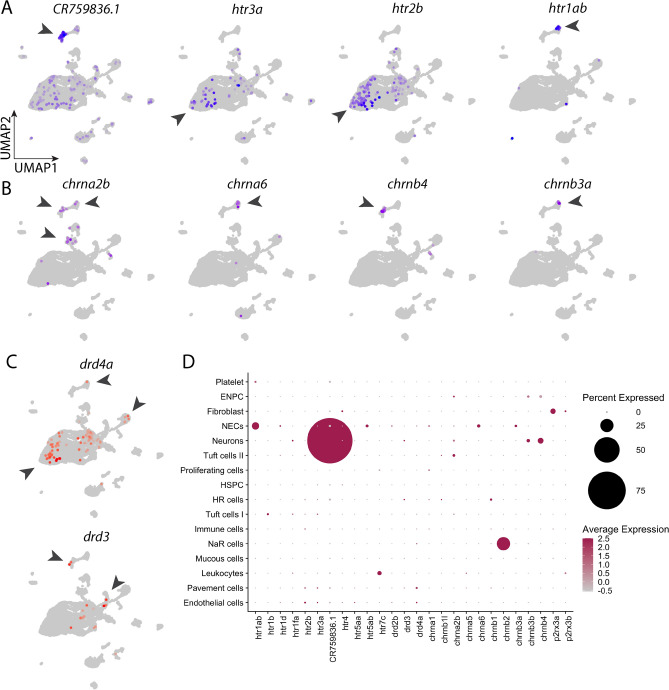
Fig. 5 Expression of neurotransmitter receptors in the gill cell atlas. (A) UMAP plots showing the distribution of selective 5-HT receptor subunits in all cell populations. Arrowheads indicate cell clusters with significant gene expression. (B) UMAP plots showing distribution of selective cholinergic receptor subunits in all cell populations. (C) UMAP plots showing distribution of selective DA receptors in all cell populations. (D) Dotplot of 5-HT, cholinergic, dopaminergic and purinergic neurotransmitter receptor subunit expression in 16 gill cell clusters. Colour intensity is proportional to the level of expression, and the size of dot indicates the percent of cells showing gene expression in the cell cluster. All dots were manually enlarged to make receptors of lower expression more visible. Scales are provided for percent and average expression. See text and Tables Tables11 and and22 for gene description.