
|
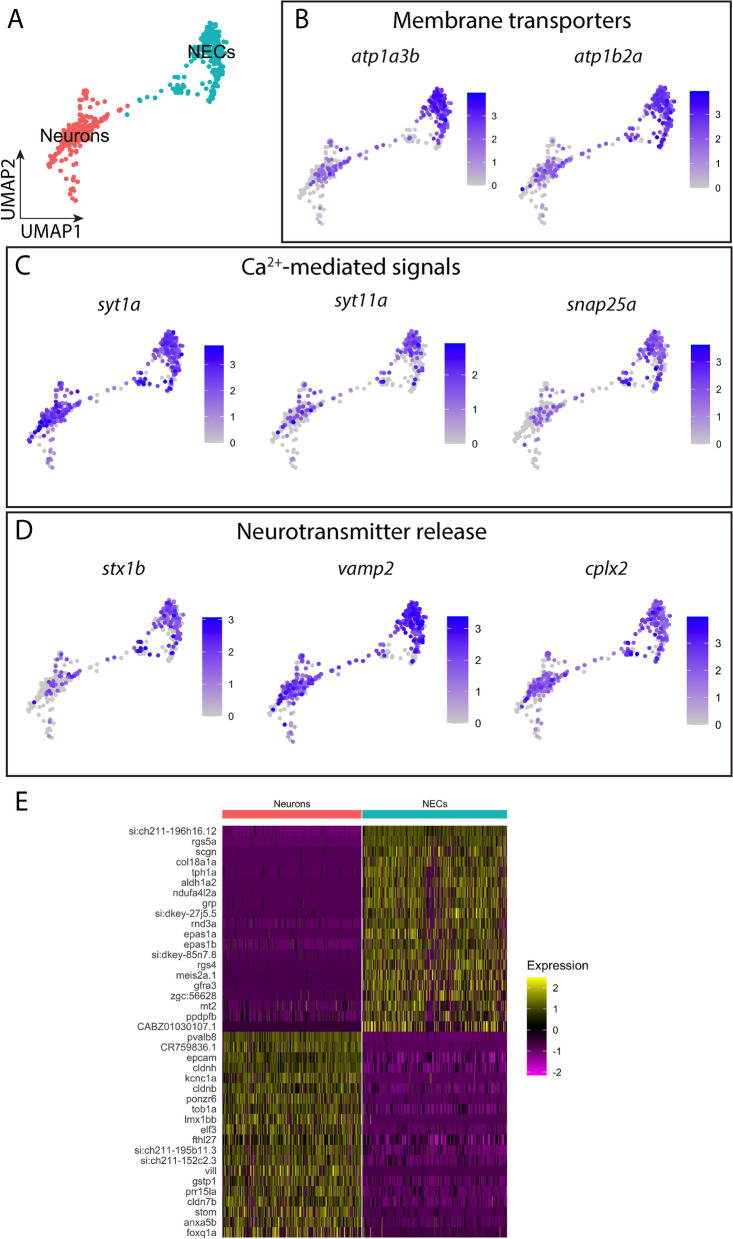
Fig. 4
Comparison of gene expression between the NEC and neuron clusters. (A) UMAP plot showing the subset of the cell population containing NECs and neurons only. (B) UMAP plots showing the log-normalized expression of genes encoding membrane transporters. (C) UMAP plots showing the log-normalized expression of genes involved in Ca2+-mediated signals. (D) UMAP plots showing the log-normalized expression of genes involved in neurotransmitter release. (E) Heatmap of the top 20 highly differentially expressed genes in NECs and neurons. Scaled gene expression is shown by colours, where yellow indicates relatively high expression and purple indicates relatively low expression. See text and Tables Tables1 and 2