
|
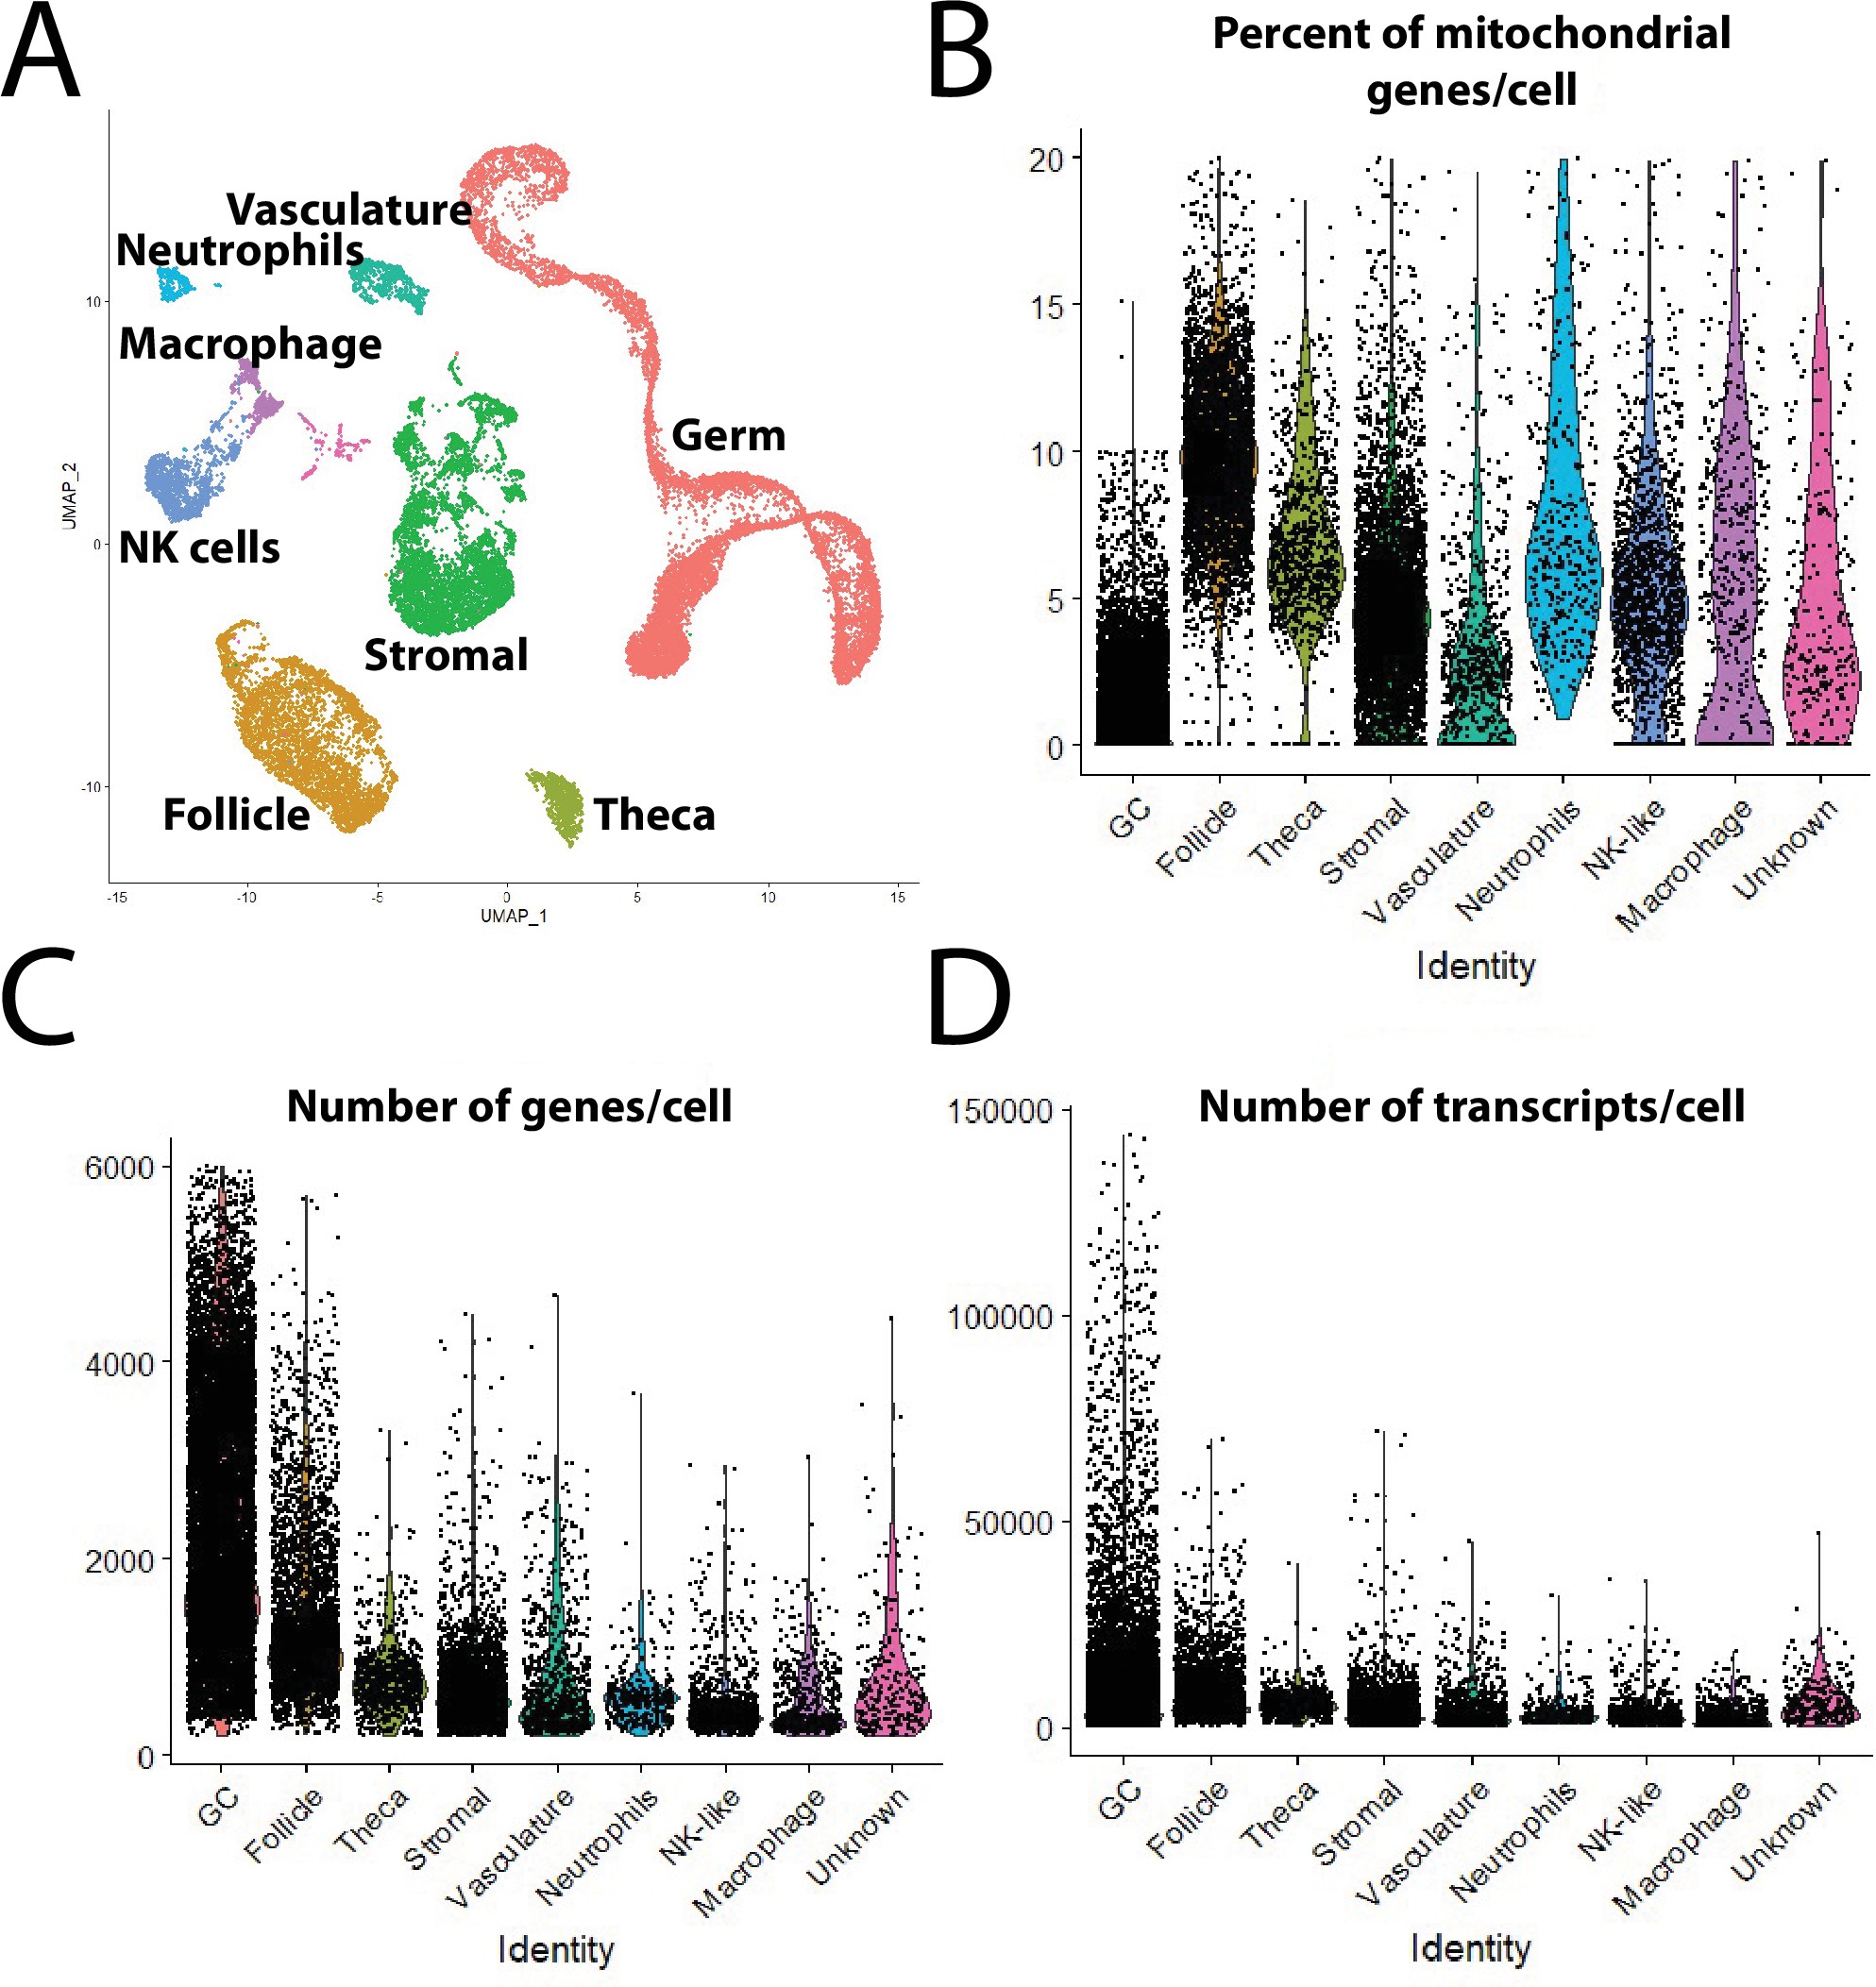
Fig. 1 - supplement 2
(A) Single-cell uniform manifold approximation and projection (UMAP) plot of 40-day-old zebrafish ovary with combined clusters based on major cell types. (B–D) Violin plot of percent of mitochondria genes (B), number of genes per cell (C), and number of transcripts per cell (D), in each major cell type in the final dataset.<
Major cell-type statistics.