
Image
|
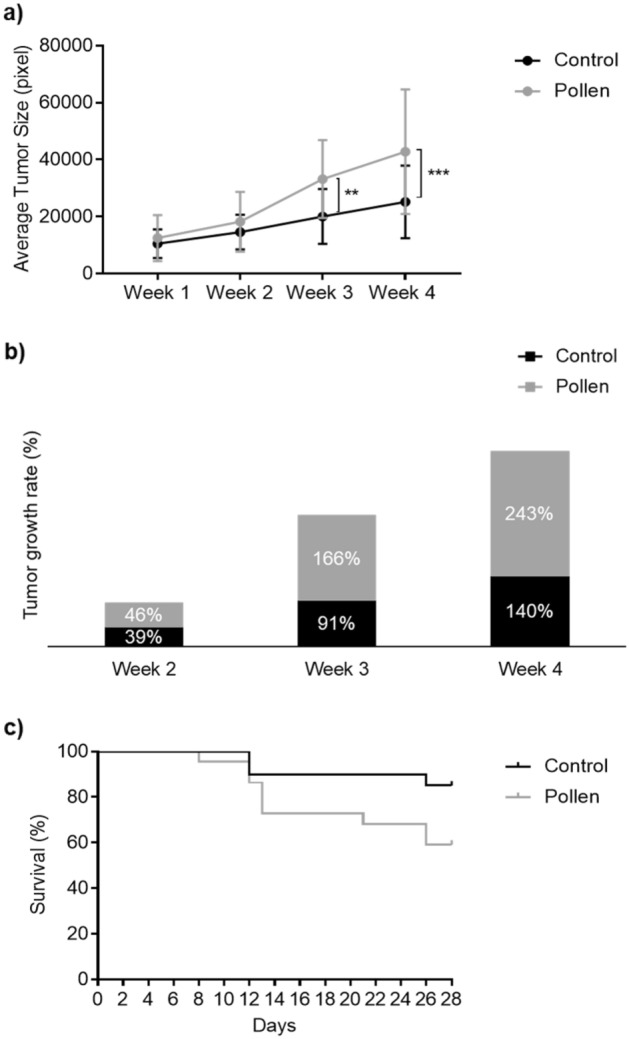
Figure Caption
Fig. 10
Adult casper zebrafish fed with control diet (black color) vs. pollen diet (gray color) over 4 weeks after melanoma allotransplant. (a) Average tumor (1 + 2) size (pixels). **p < 0.01; ***p < 0.001 according to ANOVA and Sidak’s Multiple Comparison Test. (b) Tumor growth rate (%). (c) Survival curve (%). Kaplan–Meier Gehan–Breslow–Wilcoxon and nonparametric Log-rank Test.
Acknowledgments
This image is the copyrighted work of the attributed author or publisher, and
ZFIN has permission only to display this image to its users.
Additional permissions should be obtained from the applicable author or publisher of the image.
Full text @ Sci. Rep.