
Image
|
Figure Caption
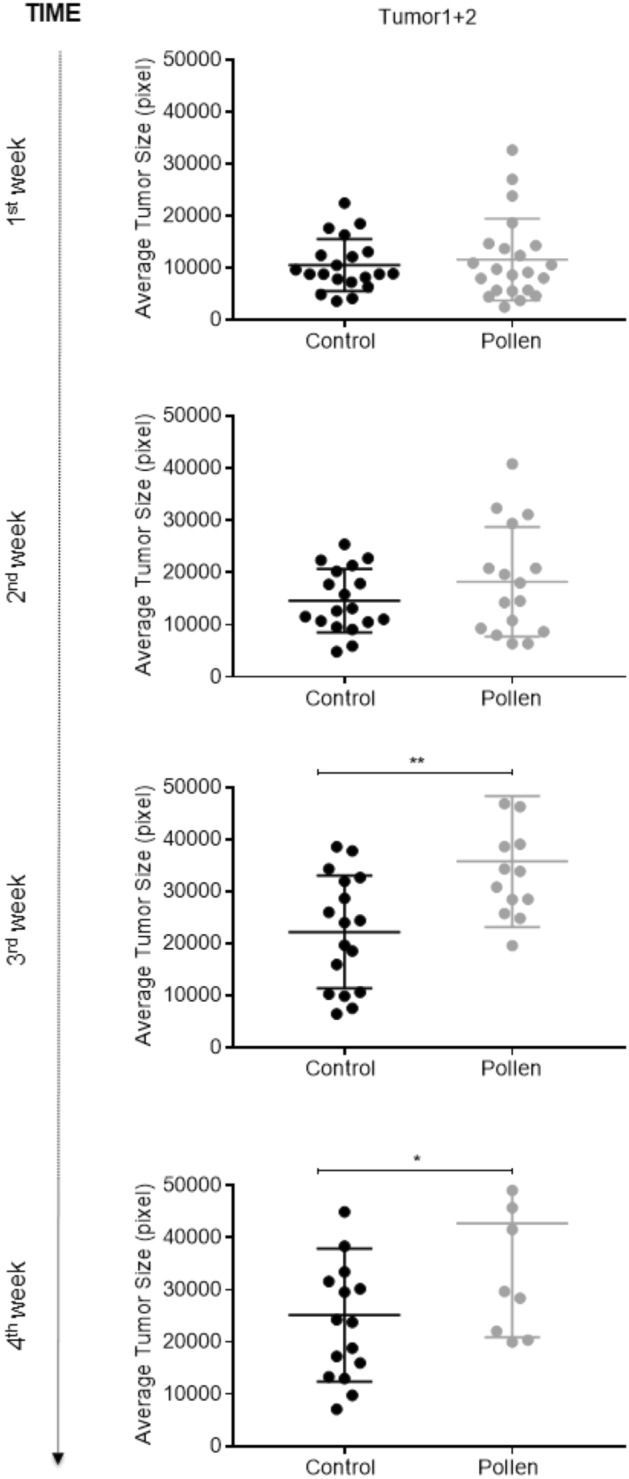
Fig. 9
Average tumor size. Average tumor (1 + 2) size (pixels) from 1 to 4 weeks’ post-transplant. Each dot corresponds to a recipient-transplanted fish and the mean ± SEM is also shown. *p < 0.05, **p < 0.01 according to unpaired Student t test.
Acknowledgments
This image is the copyrighted work of the attributed author or publisher, and
ZFIN has permission only to display this image to its users.
Additional permissions should be obtained from the applicable author or publisher of the image.
Full text @ Sci. Rep.