
Image
|
Figure Caption
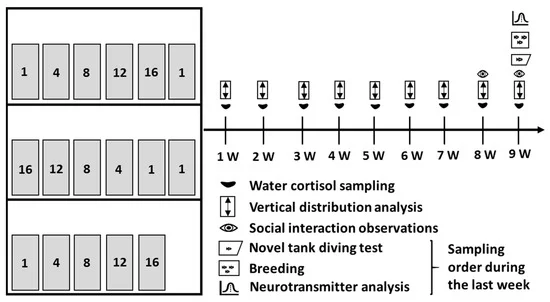
Fig. 1 Figure 1. The experimental design. The left part of the figure illustrates the experimental set-up, and the right part of the figure illustrates the time frame of the experiment. For the set-up, each shelf held at least one tank from each density treatment. The densities were placed in increasing order from left to right on the top and bottom shelf, and from right to left on the middle shelf.
Acknowledgments
This image is the copyrighted work of the attributed author or publisher, and
ZFIN has permission only to display this image to its users.
Additional permissions should be obtained from the applicable author or publisher of the image.
Full text @ Biology (Basel)