
|
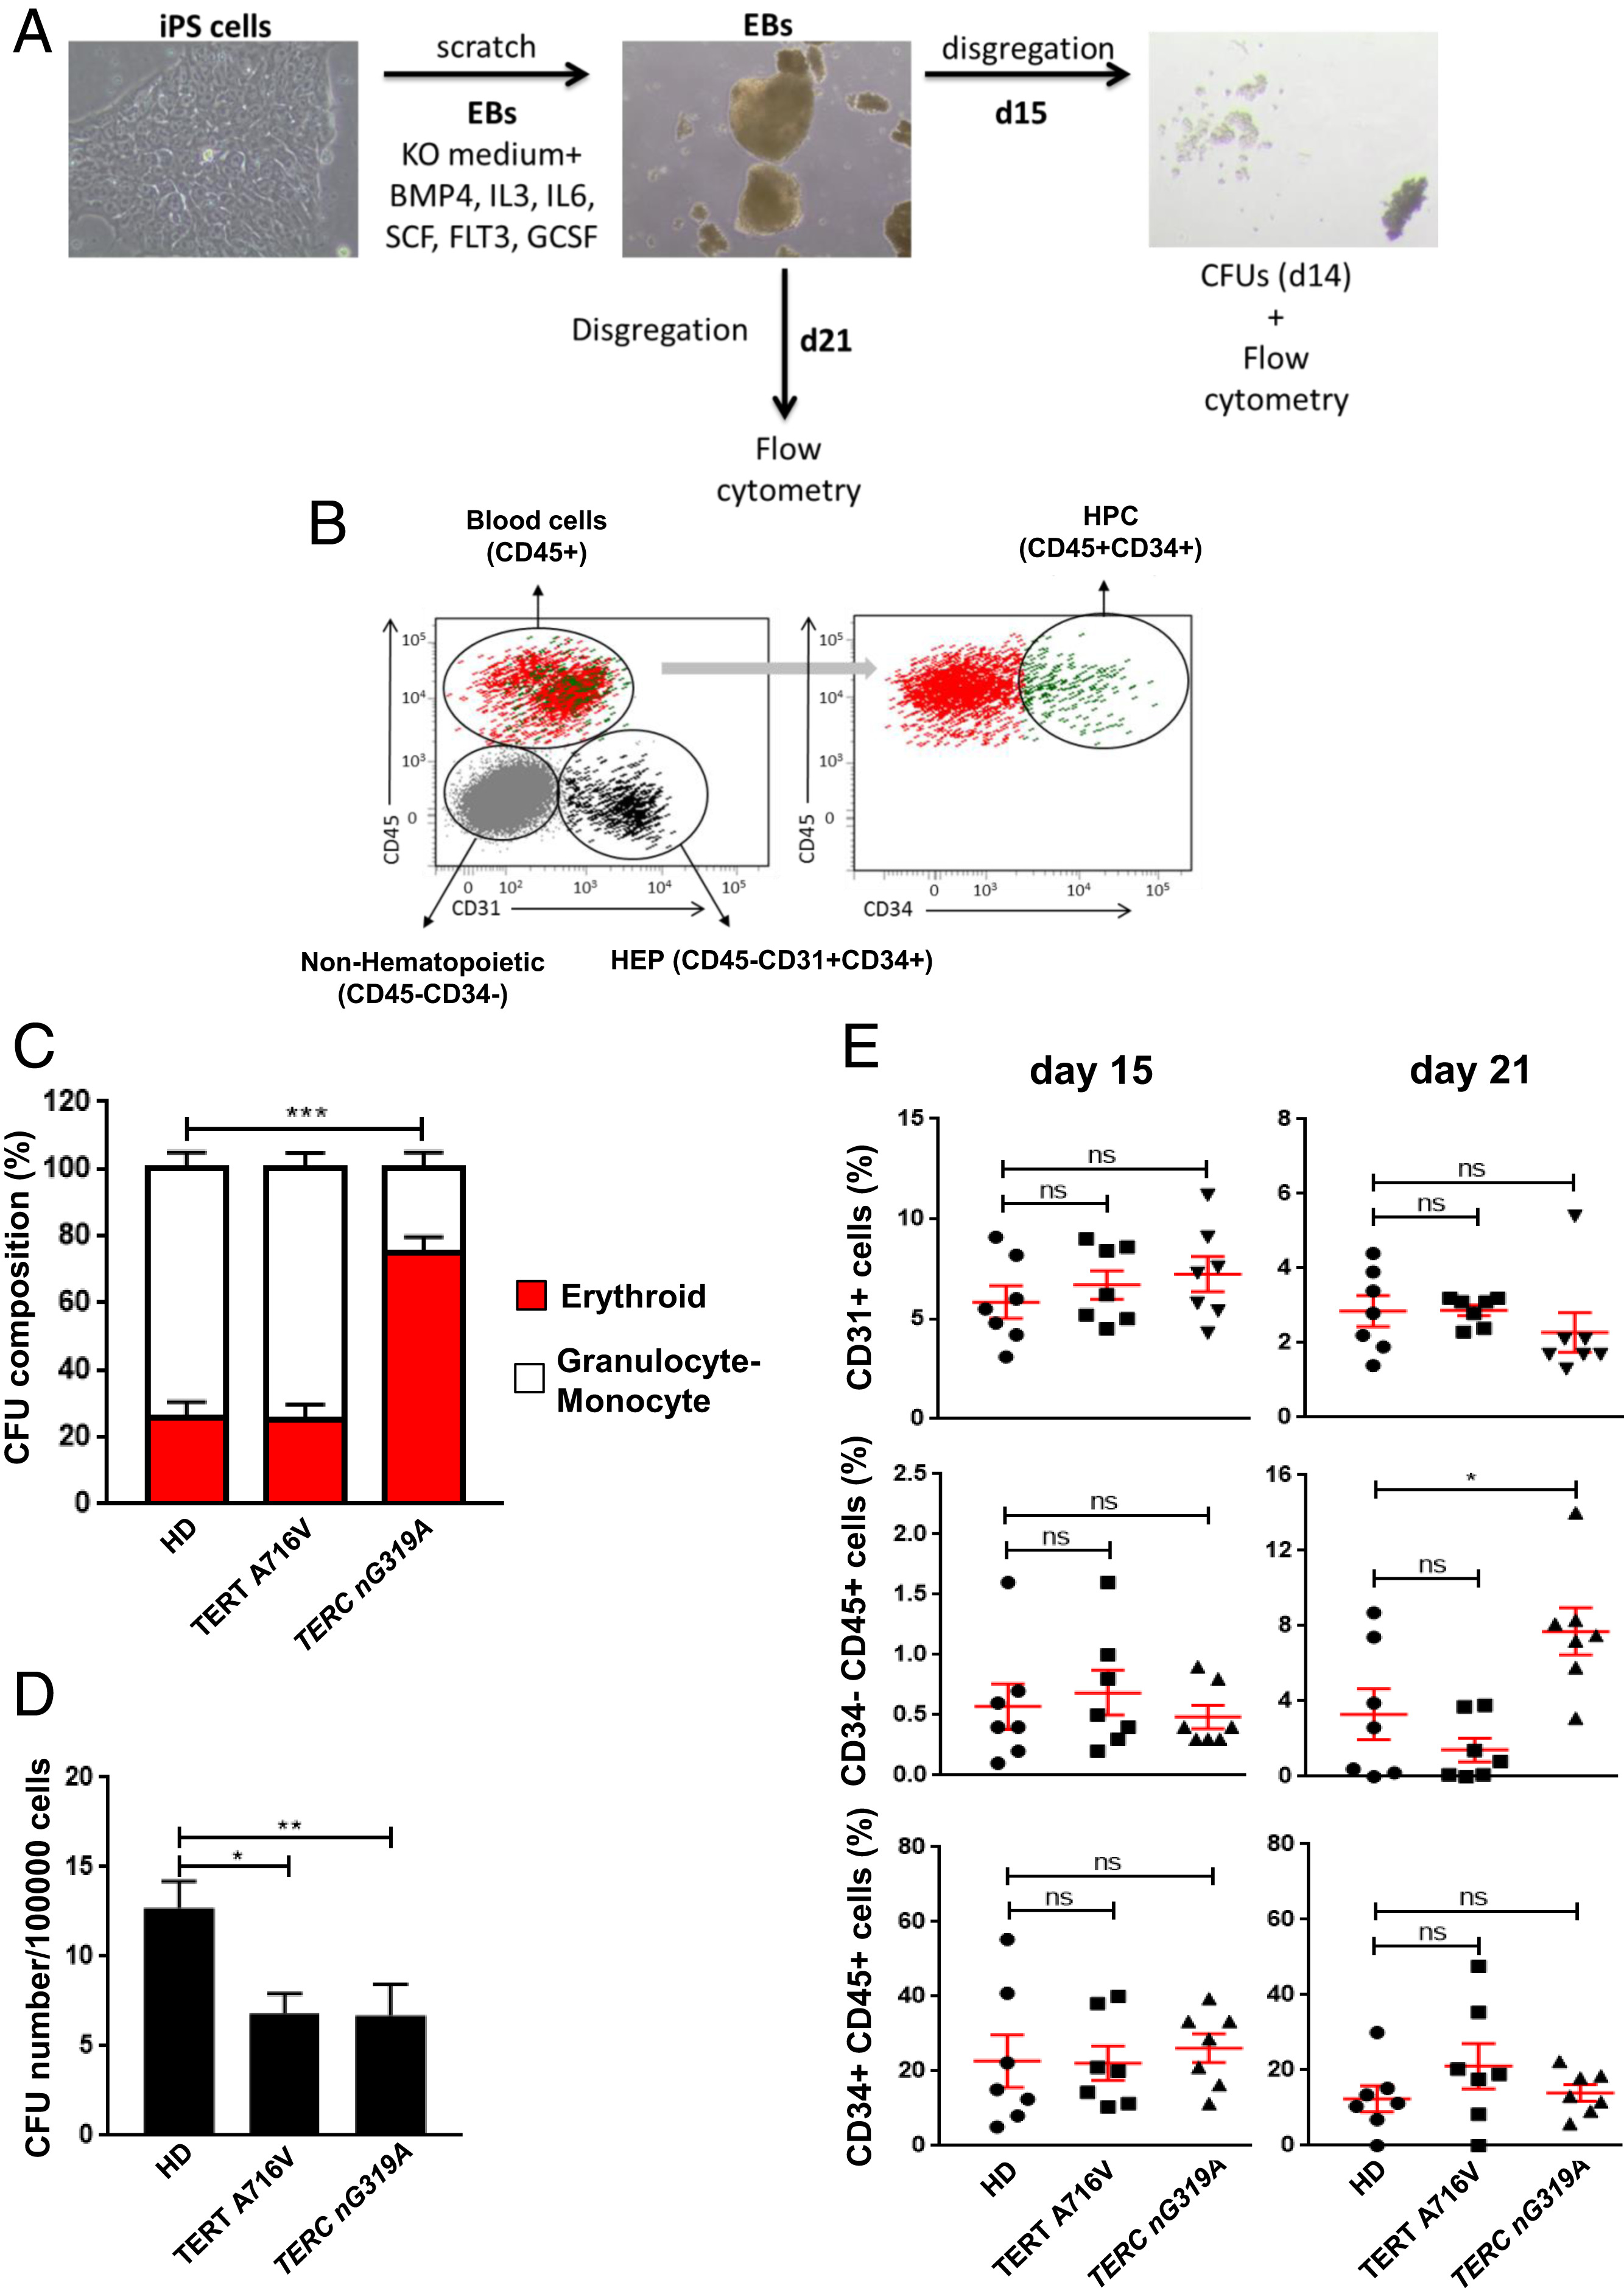
Fig. 6 iPS cells carrying a mutation in the CR4-CR5 domain of TERC fail to properly differentiate into myeloids cells. (A) Workflow for differentiation of iPS cells. (B) Dot plot and identification of different cell populations in EBs by flow cytometry. CD31+ HEP (bipotential precursors of hematopoietic and endothelial cells), CD45+ CD34+ HPC, and CD45+ mature blood cells. (C) Composition of erythroid and granulocyte/monocyte colonies in CFU assays, using EBs derived from the indicated iPS cell lines. Data are the average of seven independent EB formation experiments. (D) Number of colonies per 100,000 EB cells. Data are the average of seven independent EB formation experiments. (E) Quantification of cell populations in EBs by flow cytometry. CD31+ (HEP), CD34+CD45+ (HPC), and CD45+ (mature blood cells) cells in day 15 and 21. Data are the average of seven independent EB formation experiments. All data are mean + SEM. *P < 0.05, **P < 0.01, and ***P < 0.001 for one-way ANOVA plus Dunnet’s posttest in all the panels. ns, not significant.