
|
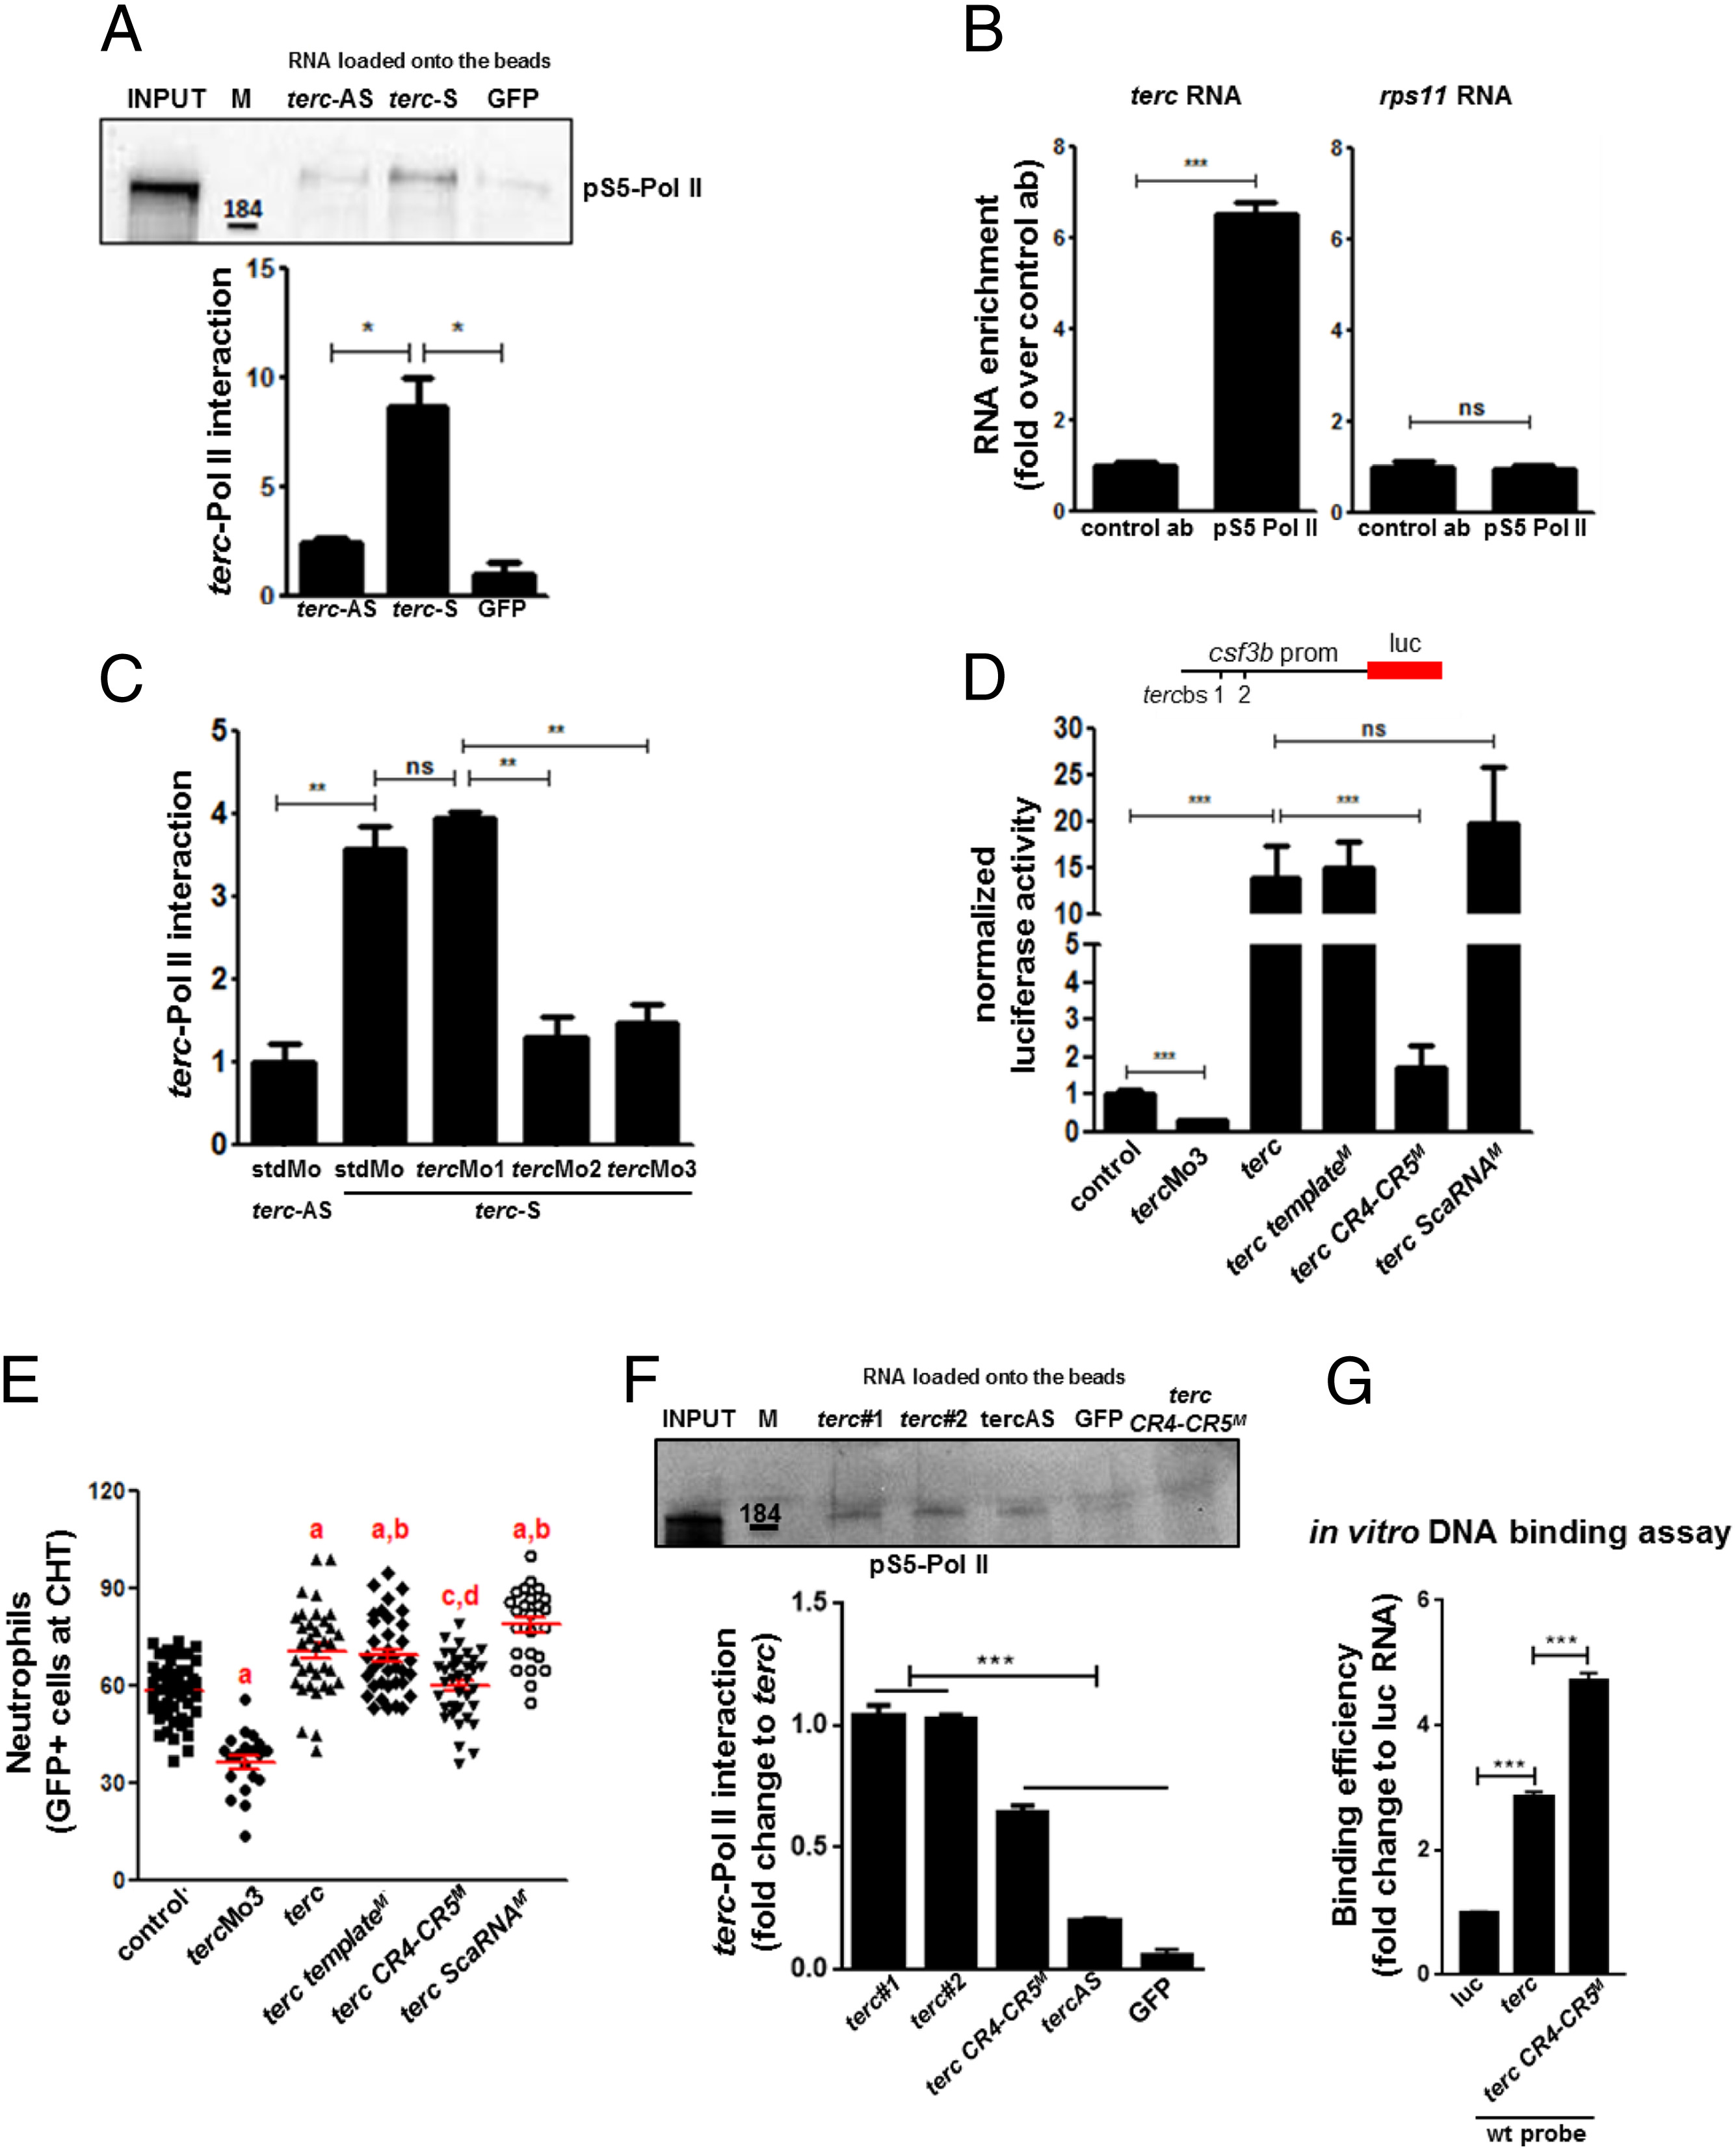
Fig. 4 Telomerase RNA binds to RNA Pol II through its CR4-CR5 domain to promote developmental myelopoiesis in zebrafish. (A) Western blot of RNA pull-down eluates using anti-Phospho S5 RNA Pol II antibodies. For quantification of the interaction, Quantity One software was used; n = 2 independent experiments; M, molecular weight marker (kDa); n = at least 500 2-d larvae per group (see Materials and Methods). (B) qRT-PCR of RIP experiment using anti-Phospho S5 RNA Pol II assessing enrichment of terc RNA. Data are representative results of three independent experiments; n = at least 500 2-d larvae per group (see Materials and Methods). (C) Quantification of terc–RNA Pol II interaction in the presence of terc Mos (reference SI Appendix, Fig. S3C for representative Western blot); n = 2 independent experiments with at least 500 larvae at 2 dpf per group (see Materials and Methods). (D) Activity of the csf3b promoter in CHT of larvae at 2 dpf after injection of the luciferase reporter construct in combination with tercMo3 or terc RNA at 200 pg/embryo; n = at least 30 larvae per group; luc, luciferase; M, mutated (reference SI Appendix, Fig. S3A). (E) Neutrophil counts in the CHT of mpx::GFP larvae at 3 dpf after injection of tercMo3 or terc RNA; n = 50, 20, 35, 36, 36, and 24 larvae at 3 dpf in control, tercMo3, wt terc, terc templateM, terc CR4-CR5M, and terc ScaRNAM, respectively; M, mutated (reference SI Appendix, Fig. S3A). (F) Western blot of RNA pull-down eluates using anti-Phospho S5 RNA Pol II antibodies and quantification of the interaction. terc#1 and terc#2 are two independent pull-down samples; n = 2 independent experiments; M, molecular weight marker (kDa). (G) qRT-PCR of in vitro DNA binding assay eluates. luc, luciferase RNA. Data values shown are fold change over the value of GFP sample in A, the control antibody (ab) sample in B, the stdMo (standard morpholino) + terc − AS sample in C, the control sample in D, the terc#1 sample in F, and the luciferase sample in G. All data are mean + SEM. *P < 0.05, **P < 0.01, and ***P < 0.001 for Student’s t test in B and for one-way ANOVA plus Bonferroni posttest in A, C, D, E, F, and G; a is P < 0.05 versus control, b is not significant versus wt terc molecule, c is not significant versus control, and d is P < 0.05 versus wt terc molecule, one-way ANOVA plus Bonferroni posttest; ns, not significant.