
|
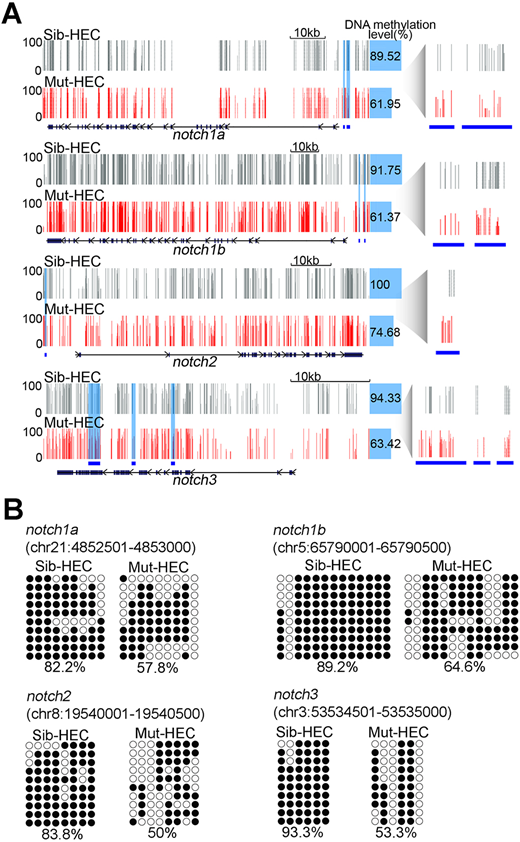
Fig. 6
Loss of Dnmt1 reduces methylation levels of Notch genes. (A) Representative display of DNA methylation at Notch signaling-related genes in HECs in sibling and dnmt1 mutants. Blue shading and blue lines show DMRs. Each vertical line on tacks represents a 5mC site. (B) Bisulfite sequencing analysis of DNA methylation at DMRs in notch1a, notch1b, notch2 and notch3 in HECs in sibling and dnmt1 mutants. Filled circle, methylated CpG; unfilled circle, unmethylated CpG. The number underneath each sequencing diagram indicates the percentage of all methylated CpG sites over the total number of CpG sites of the sequenced colonies for each sample.