
|
Fig. 10-supplement 1
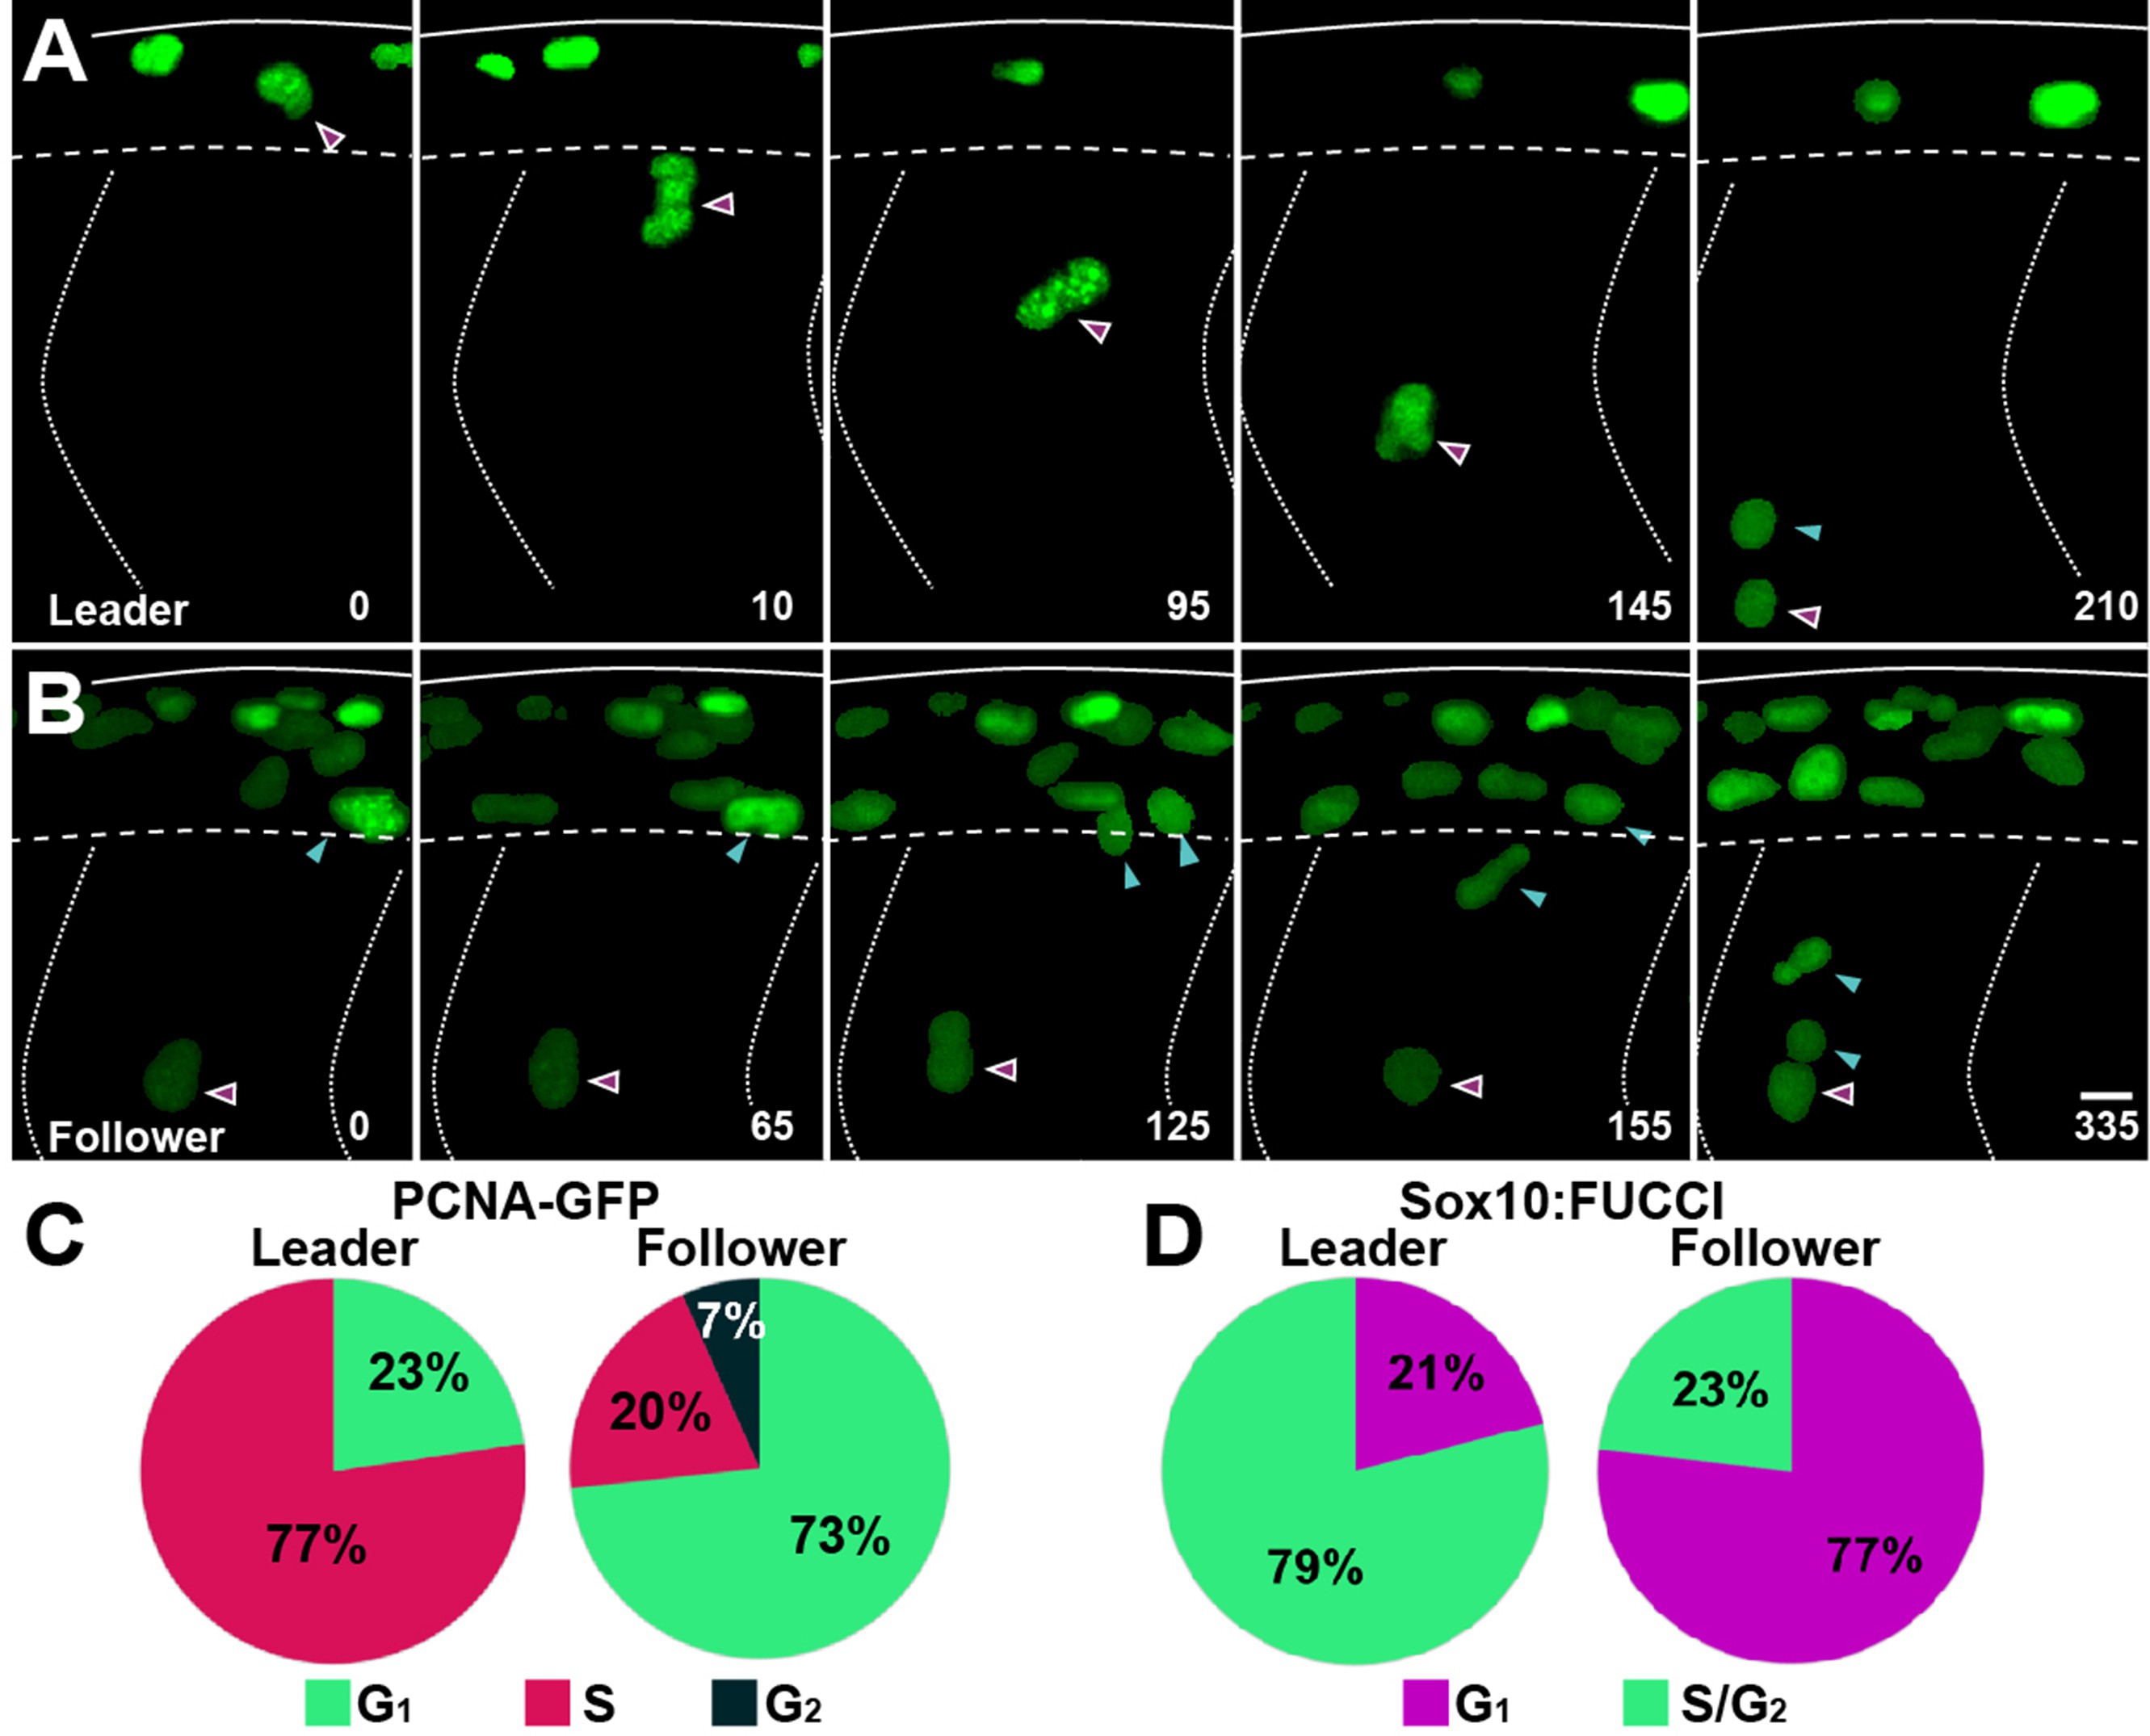
(A, B) Selected frames of in vivo imaging from Sox10:Kalt4 embryos injected with PCNA-GFP mRNA, showing PCNA localisation in trunk neural crest (TNC). (A) Leader cell initiates migration in S-phase. (B) Follower cell divides before initiating migration in G1. Solid lines indicate embryo dorsal border, dotted lines the somite borders, segmented line the premigratory ventral border. Time in minutes. Anterior to the left, dorsal up. (C) Quantification of the cell cycle phase at which cells initiate migration in PCNA-GFP mRNA injected embryos (leaders n = 22, 10 embryos; followers n = 45, 10 embryos). (D) Quantification of the cell cycle phase at which cells initiate migration in Sox10:FUCCI embryos (leaders n = 38, four embryos; followers n = 43, four embryos).
Leader and follower cells initiate migration at distinct cell cycle phases.