
|
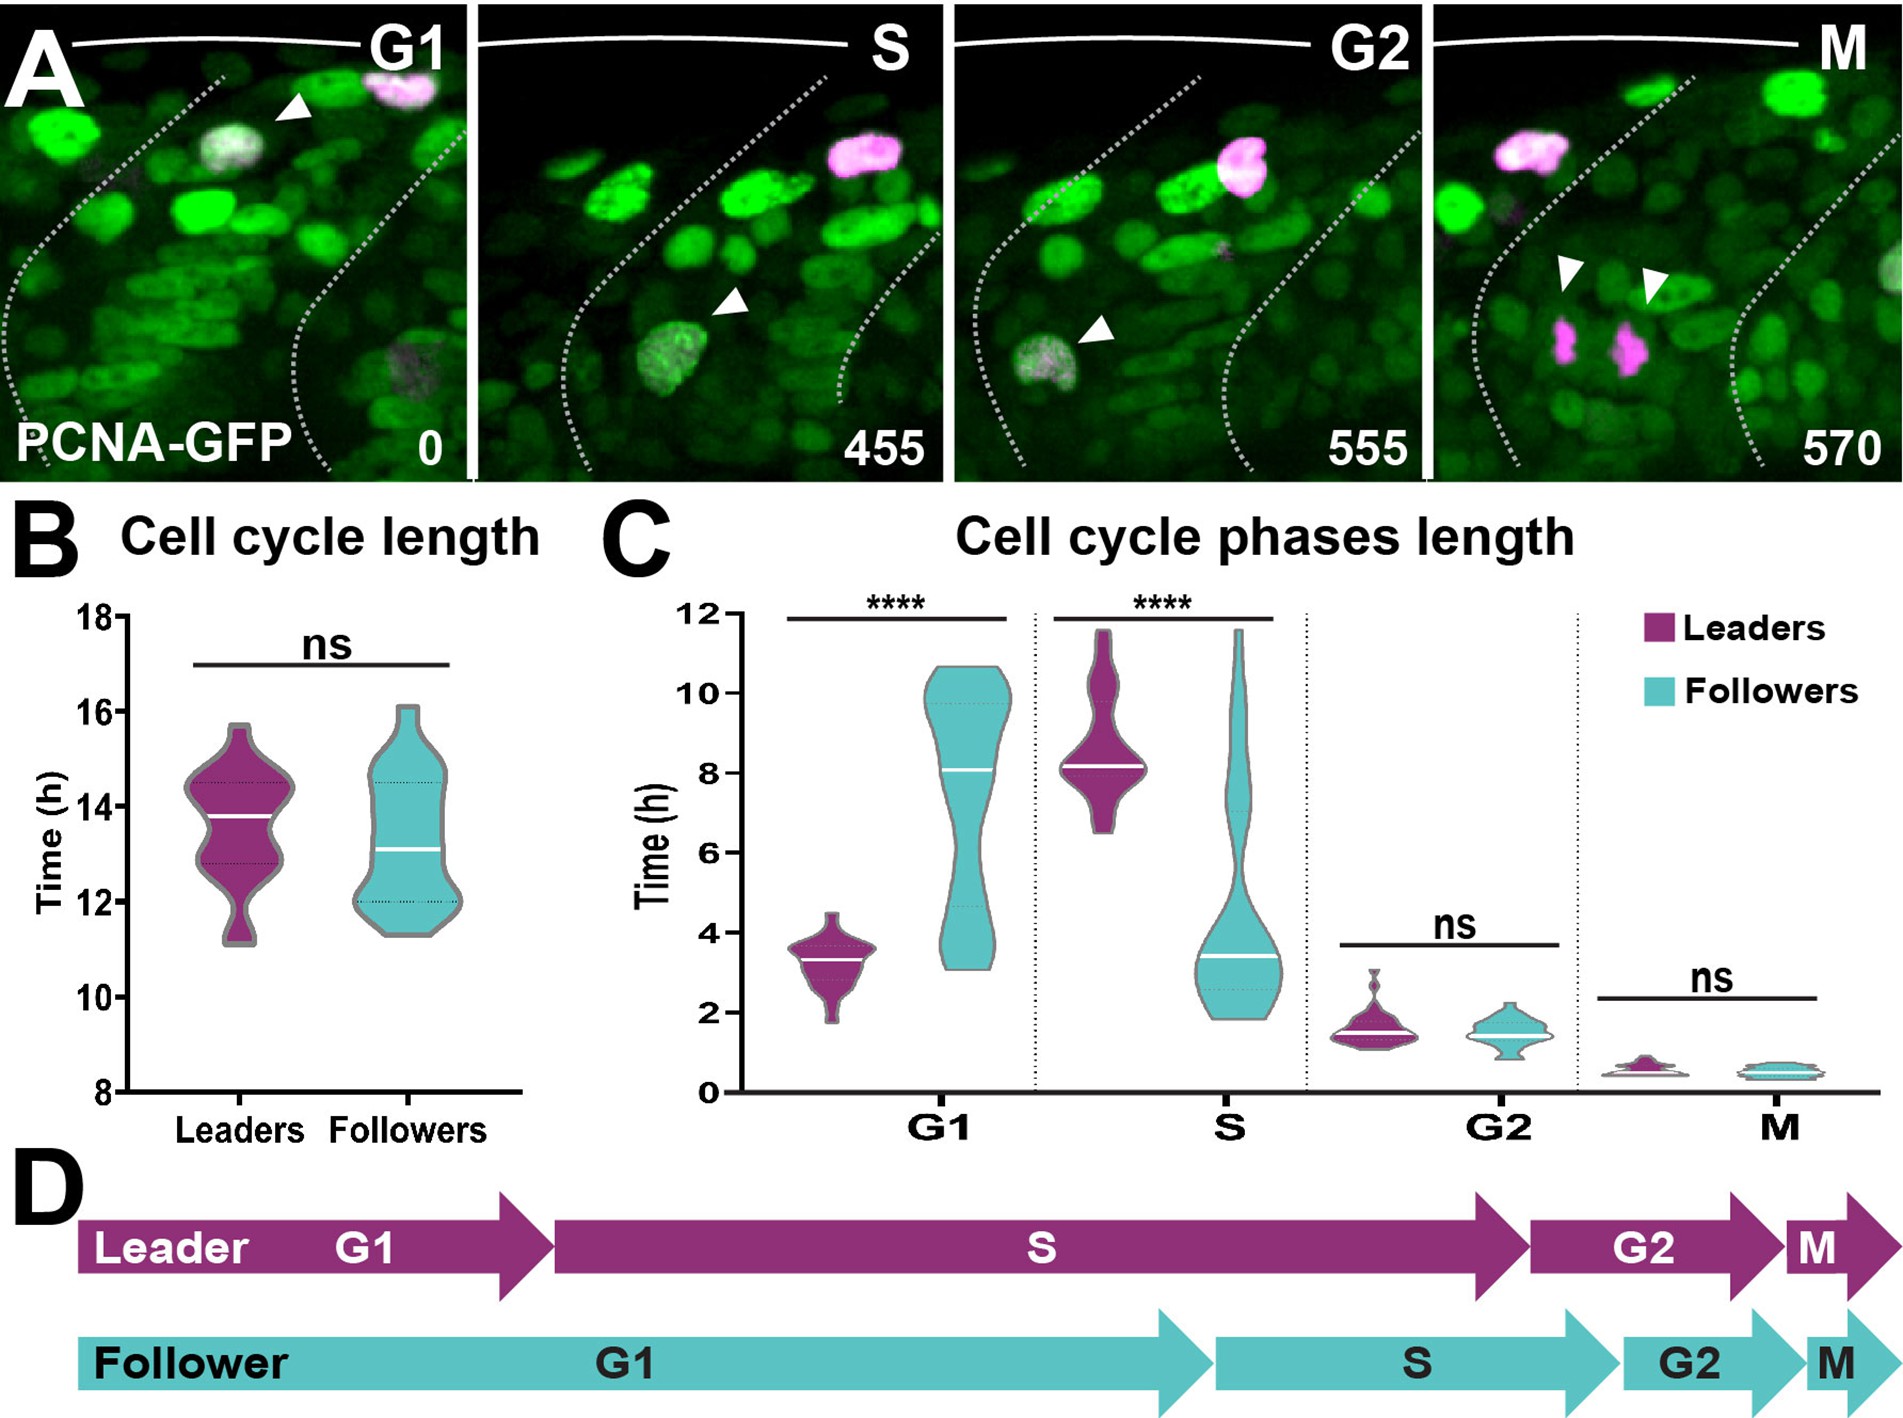
Fig. 10
(A) Selected frames from in vivo imaging of Sox10:Kalt4 embryos from 16 to 28 hpf injected with PCNA-GFP mRNA. White arrow points to cycling cell. Time in minutes. (B) Quantification of the cell cycle total duration in leaders (n = 20, seven embryos) and followers (n = 19, seven embryos; unpaired t-test, p=0.5240). (C) Quantification of the cell cycle phases duration in leaders (G1 n = 45, S n = 44, G2 n = 33 and M n = 32, 11 embryos) and followers (G1 n = 50, S n = 48, G2 n = 33 and M n = 34, 11 embryos). Brown–Forsythe and Welch’s ANOVA tests, G1 p<0.0001, S p<0.0001, G2 p=0.9997, M p=0.9231. (D) Schematic representation of the cell cycle phases durations.
Leader and follower cells progress through the cell cycle at different rates.