
|
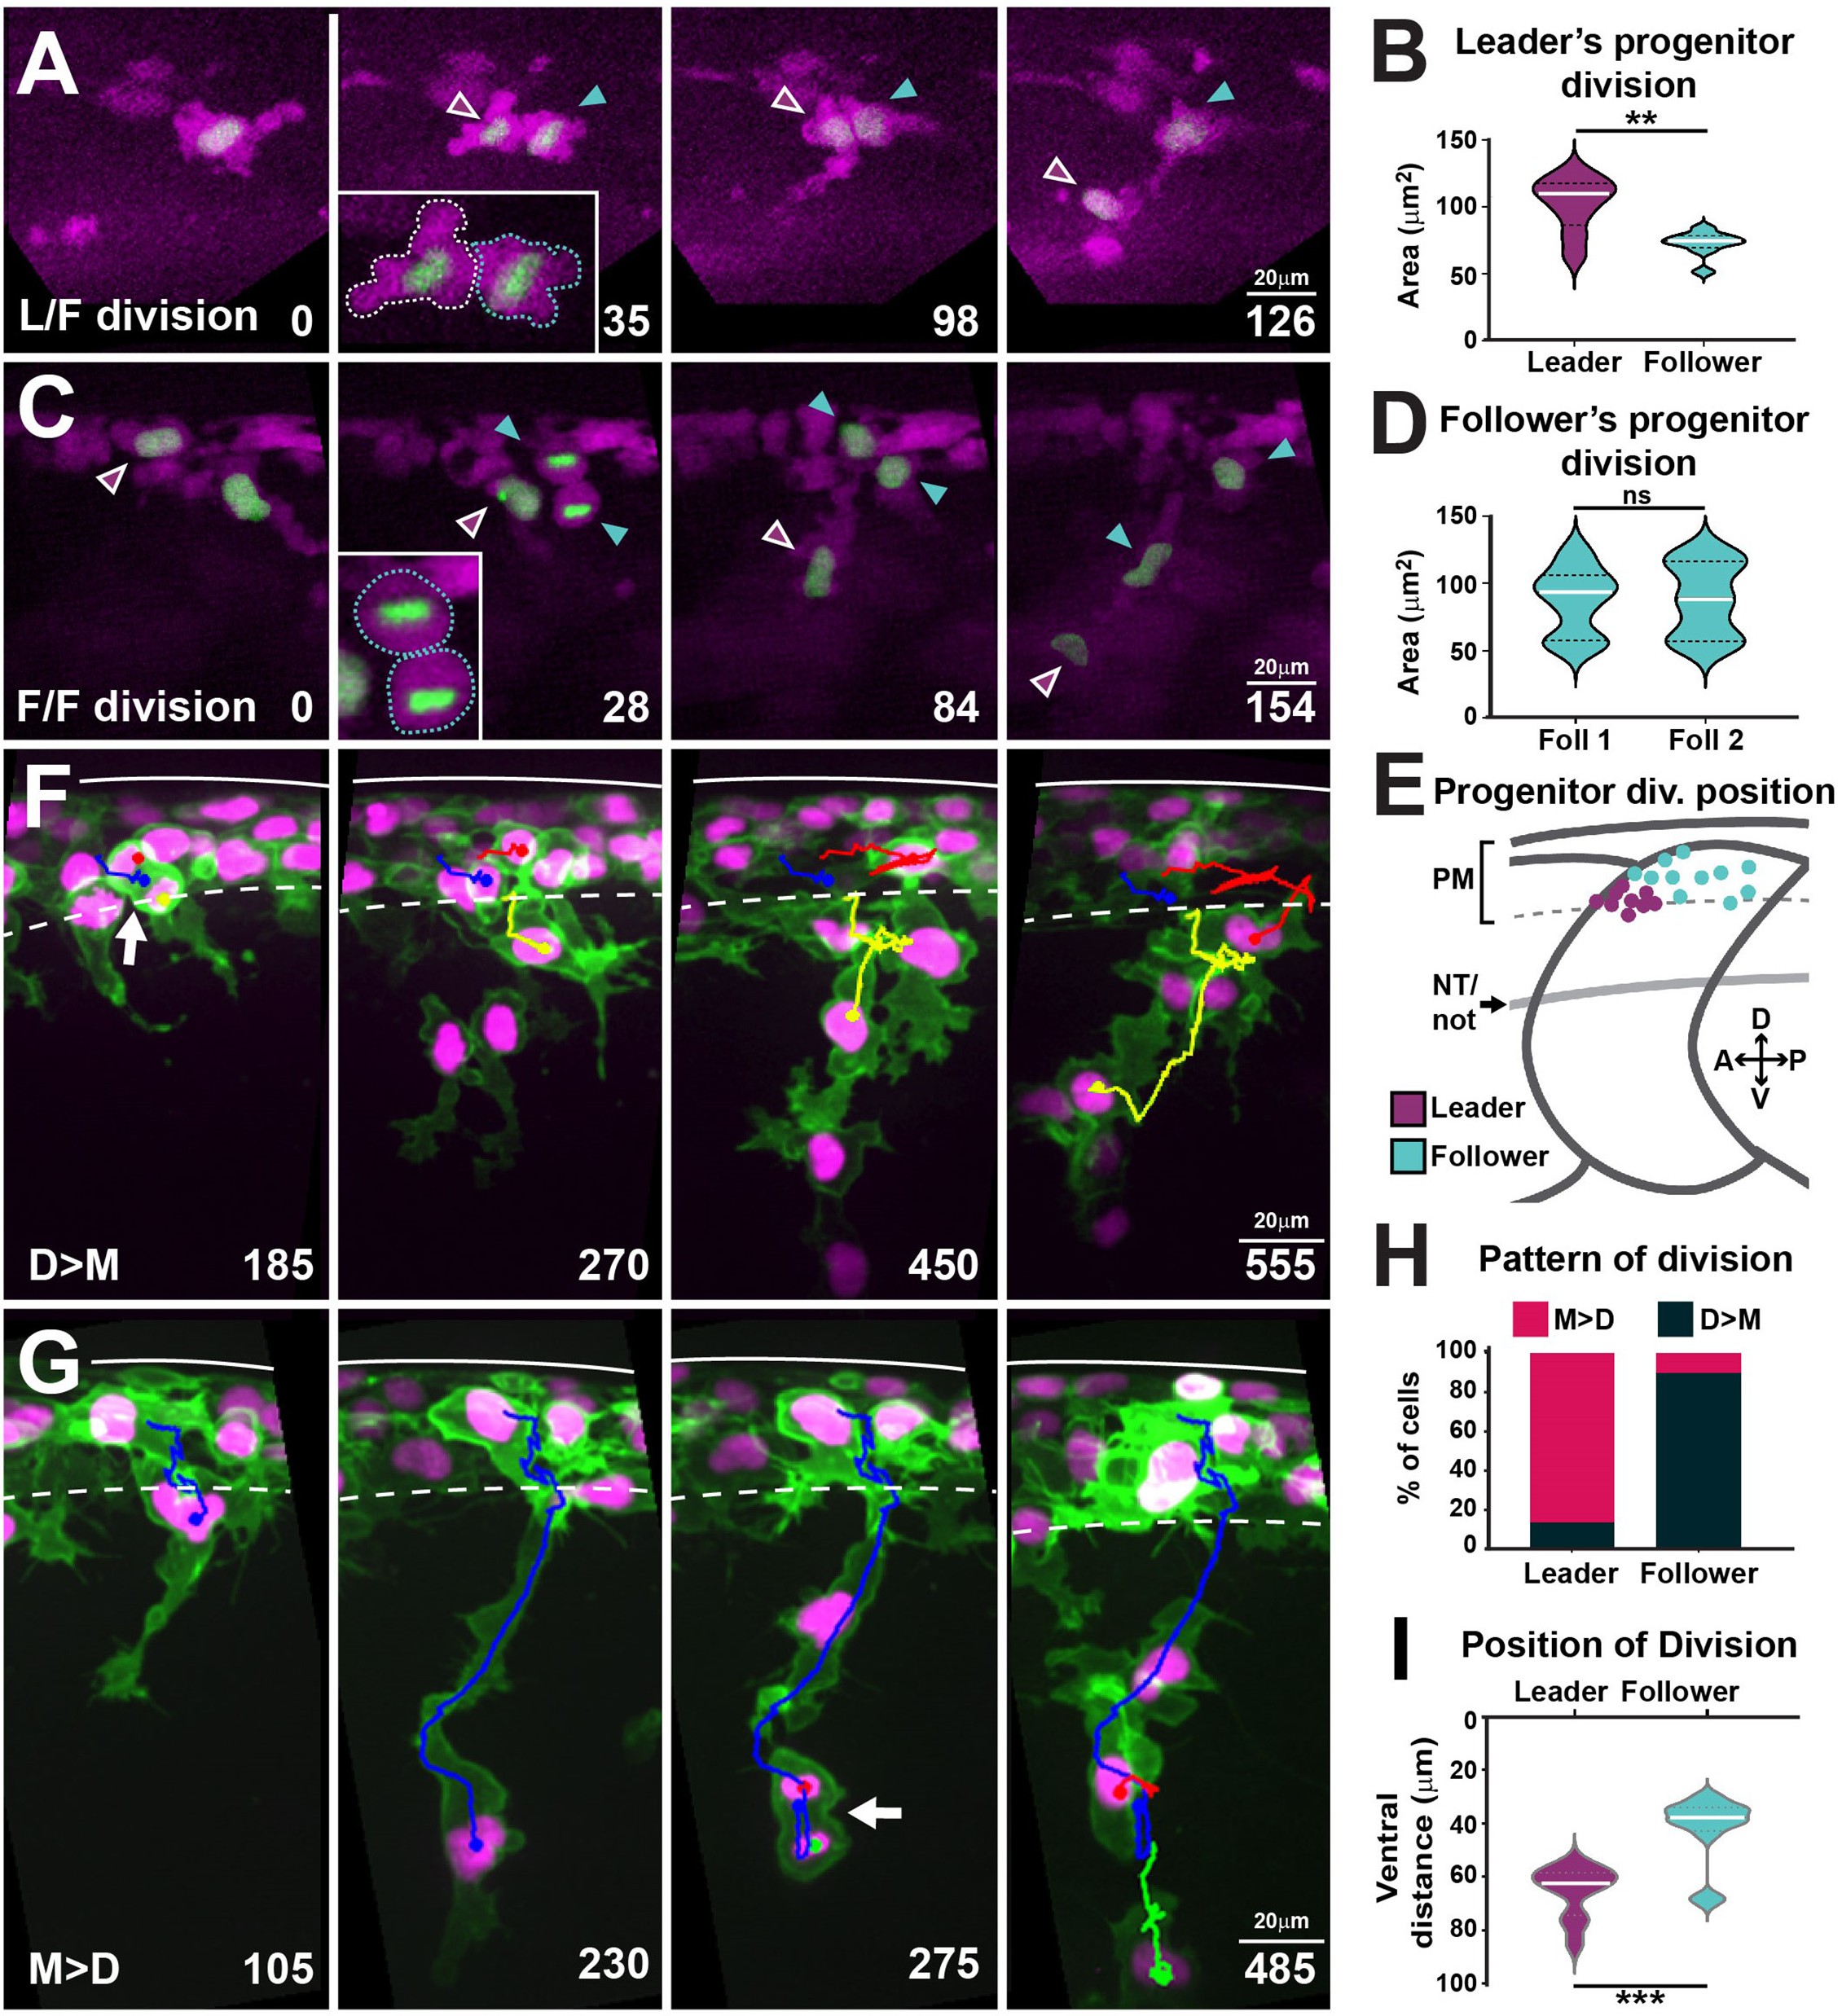
Fig. 8
(A) Selected frames from in vivo imaging of leaders’ progenitor division in FoxD3:mCherry;H2aFVA:H2a-GFP embryos. (B) Area of leaders’ progenitor daughter cells (n = 9 cells, seven embryos; Mann–Whitney U-test, p=0.0056). (C) Selected frames from in vivo imaging of followers’ progenitor division in FoxD3:mCherry;H2aFVA:H2a-GFP embryos. (D) Area of followers’ progenitor daughter cells (n = 10, four embryos; Mann–Whitney U-test, p>0.9999). (E) Position of progenitors’ divisions on model embryo (leaders n = 9, seven embryos; followers n = 10, four embryos). PM, premigratory area; NT/not, neural tube/notochord boundary. (F) Selected frames showing the D>M division pattern from 16 to 28 hpf in vivo imaging of a Sox10:mG embryo. Blue, before division; yellow and red, after division. Arrow indicates division position. (G) Selected frames showing the M>D division pattern from 16 to 28 hpf in vivo imaging of a Sox10:mG embryo. Labelling as in (F). (H) Quantification of leaders’ (n = 21, seven embryos) and follower’s division patterns (n = 43, seven embryos). Red, M>D; black, D>M. (I) Quantification of division positions (n = 13 leaders, n = 19 followers, seven embryos; Mann–Whitney U-test, p=0.0002). Time in minutes. Leaders in magenta, followers in cyan. Anterior left, dorsal top.
Leaders arise from the asymmetric division of a progenitor cell and present characteristic division patterns.