
|
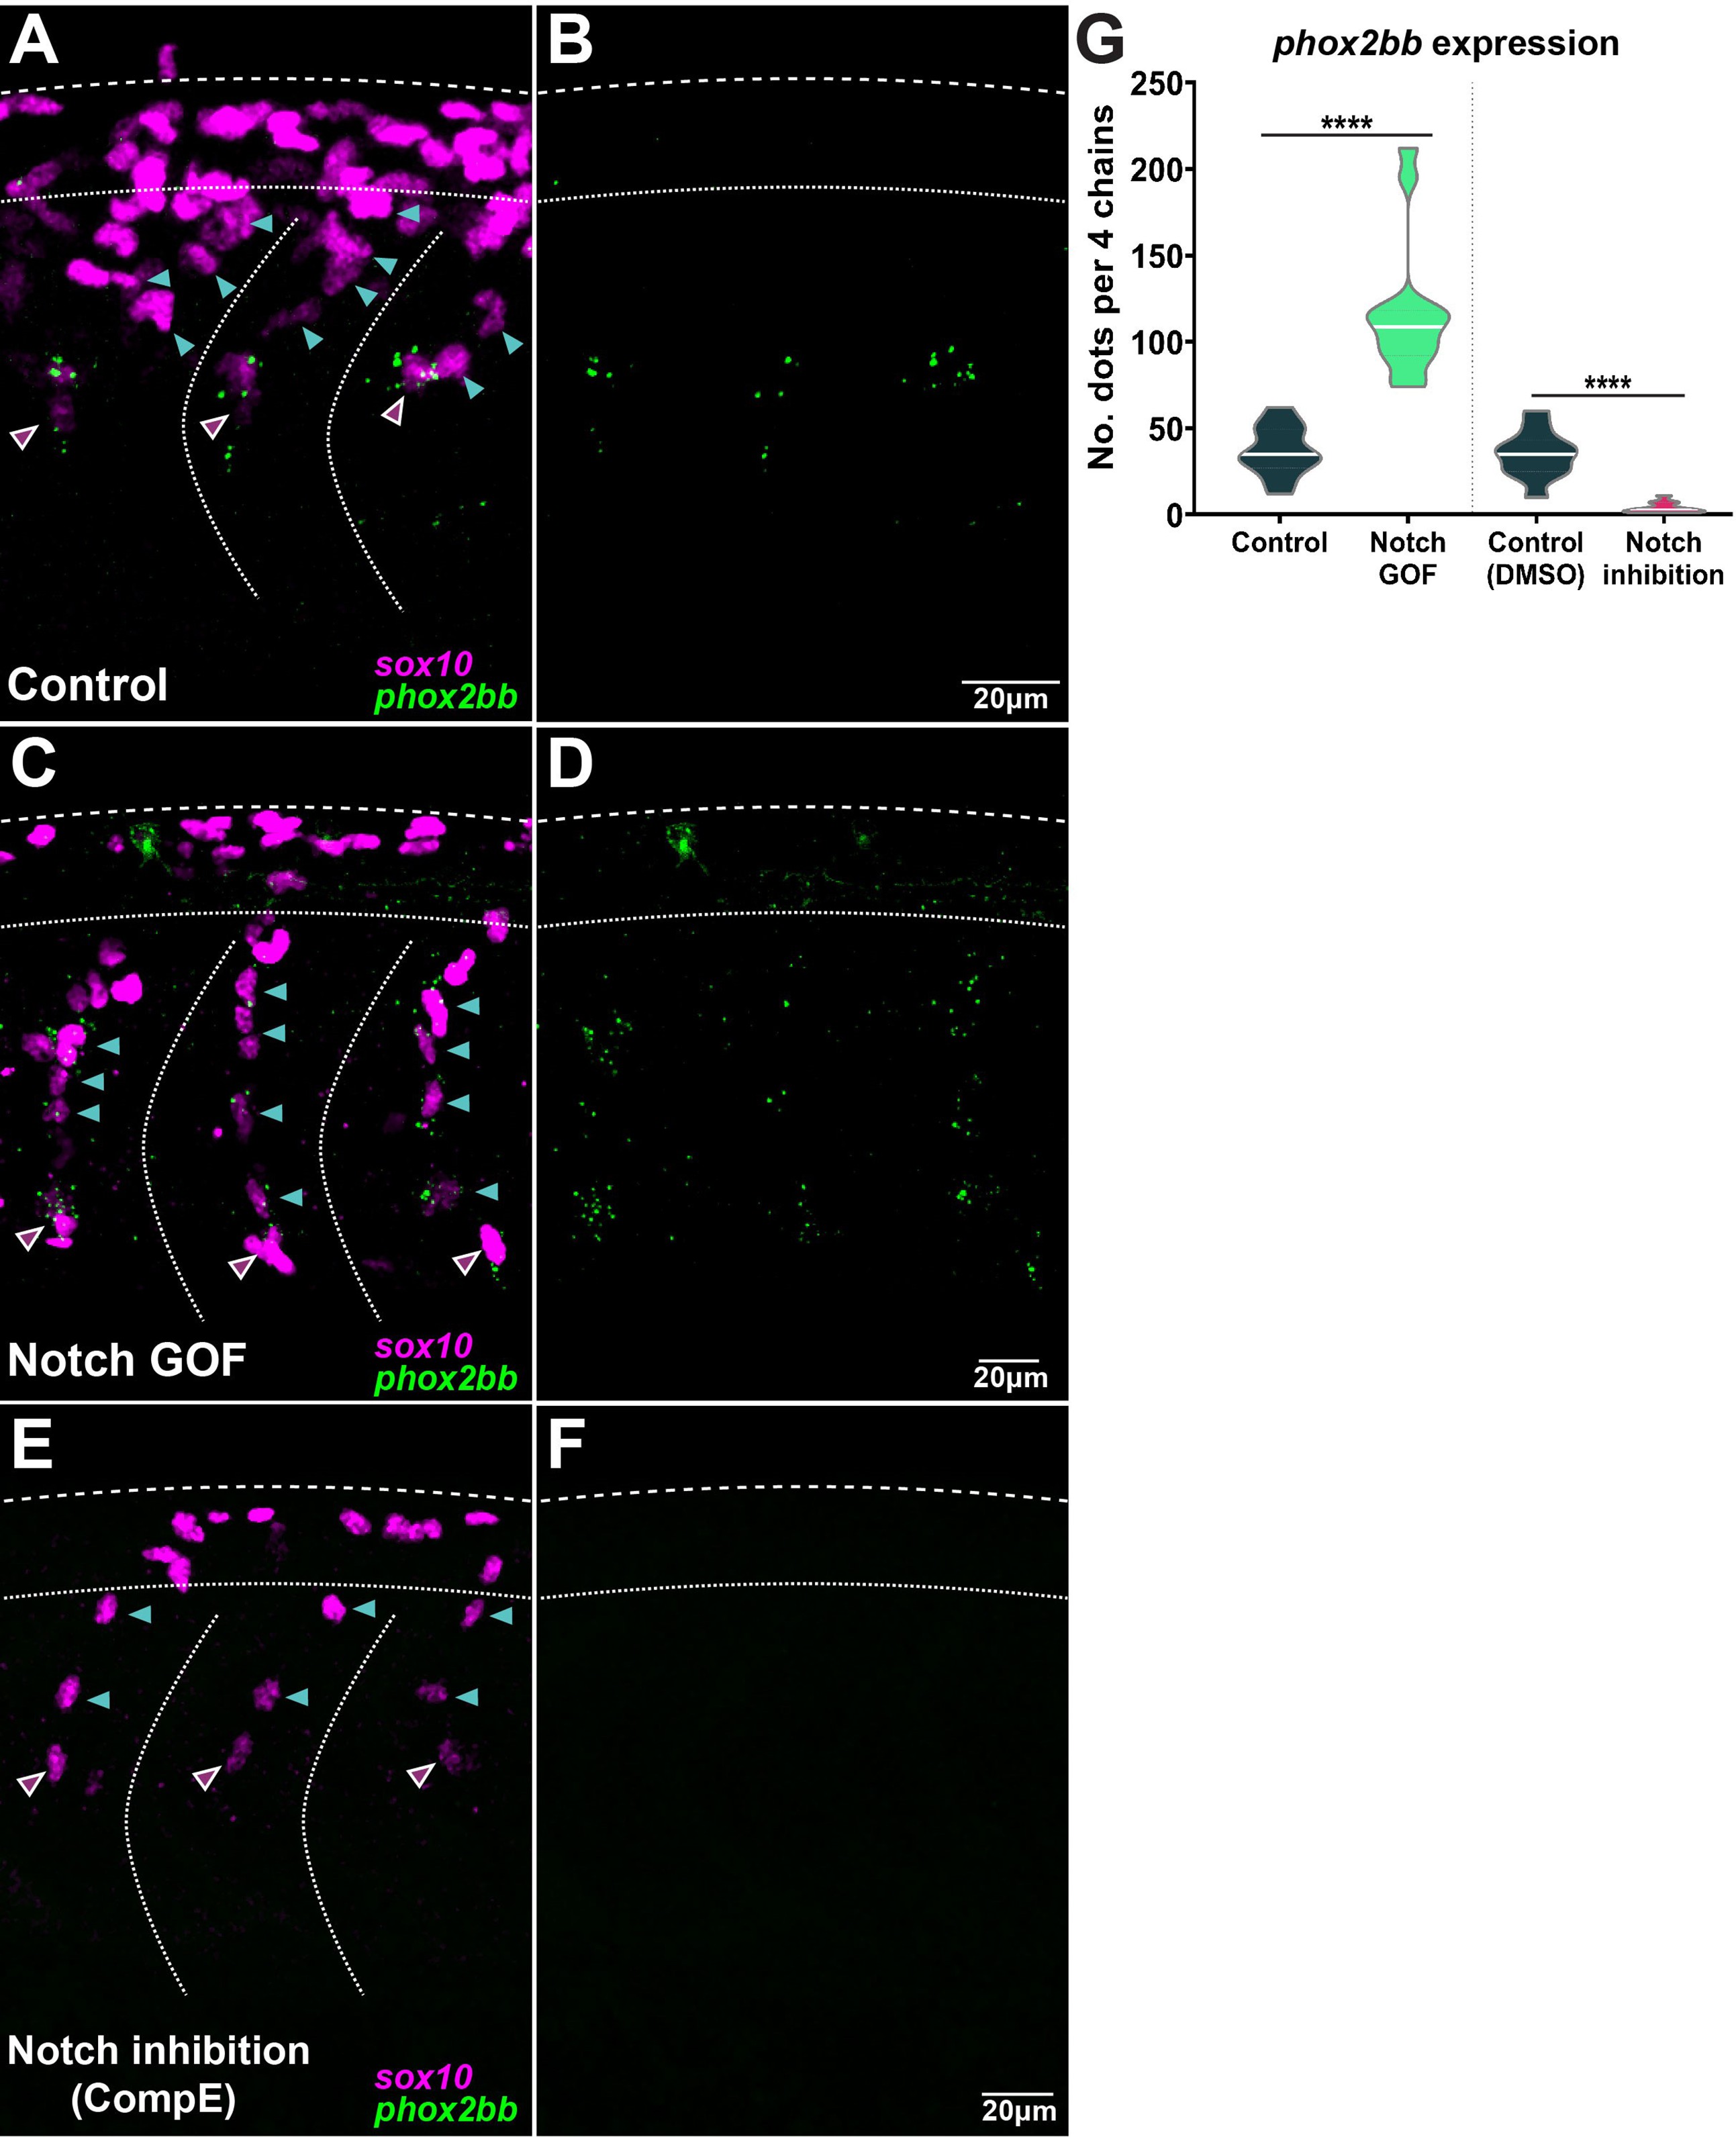
Fig. 6
(A, B) Images of phox2bb expression in control embryos (Sox10:Kalt4). (C, D) Images of phox2bb expression under Notch gain of function (GOF) conditions (Sox10:Kalt4; UAS:NICD embryos). (E, F) Images of phox2bb expression in Notch inhibition conditions (Compound E). Magenta and cyan arrowheads indicate leaders and followers respectively. (G) Quantification of phox2bb expression in control (n = 13), Notch GOF (n = 14), and Notch inhibition conditions (n = 11). Welch’s t-test, Kalt4 control vs. GOF ****p<0.0001, DMSO control vs. inhibition ****p<0.0001.
Notch signalling controls phox2bb expression defining leader cells.