
|
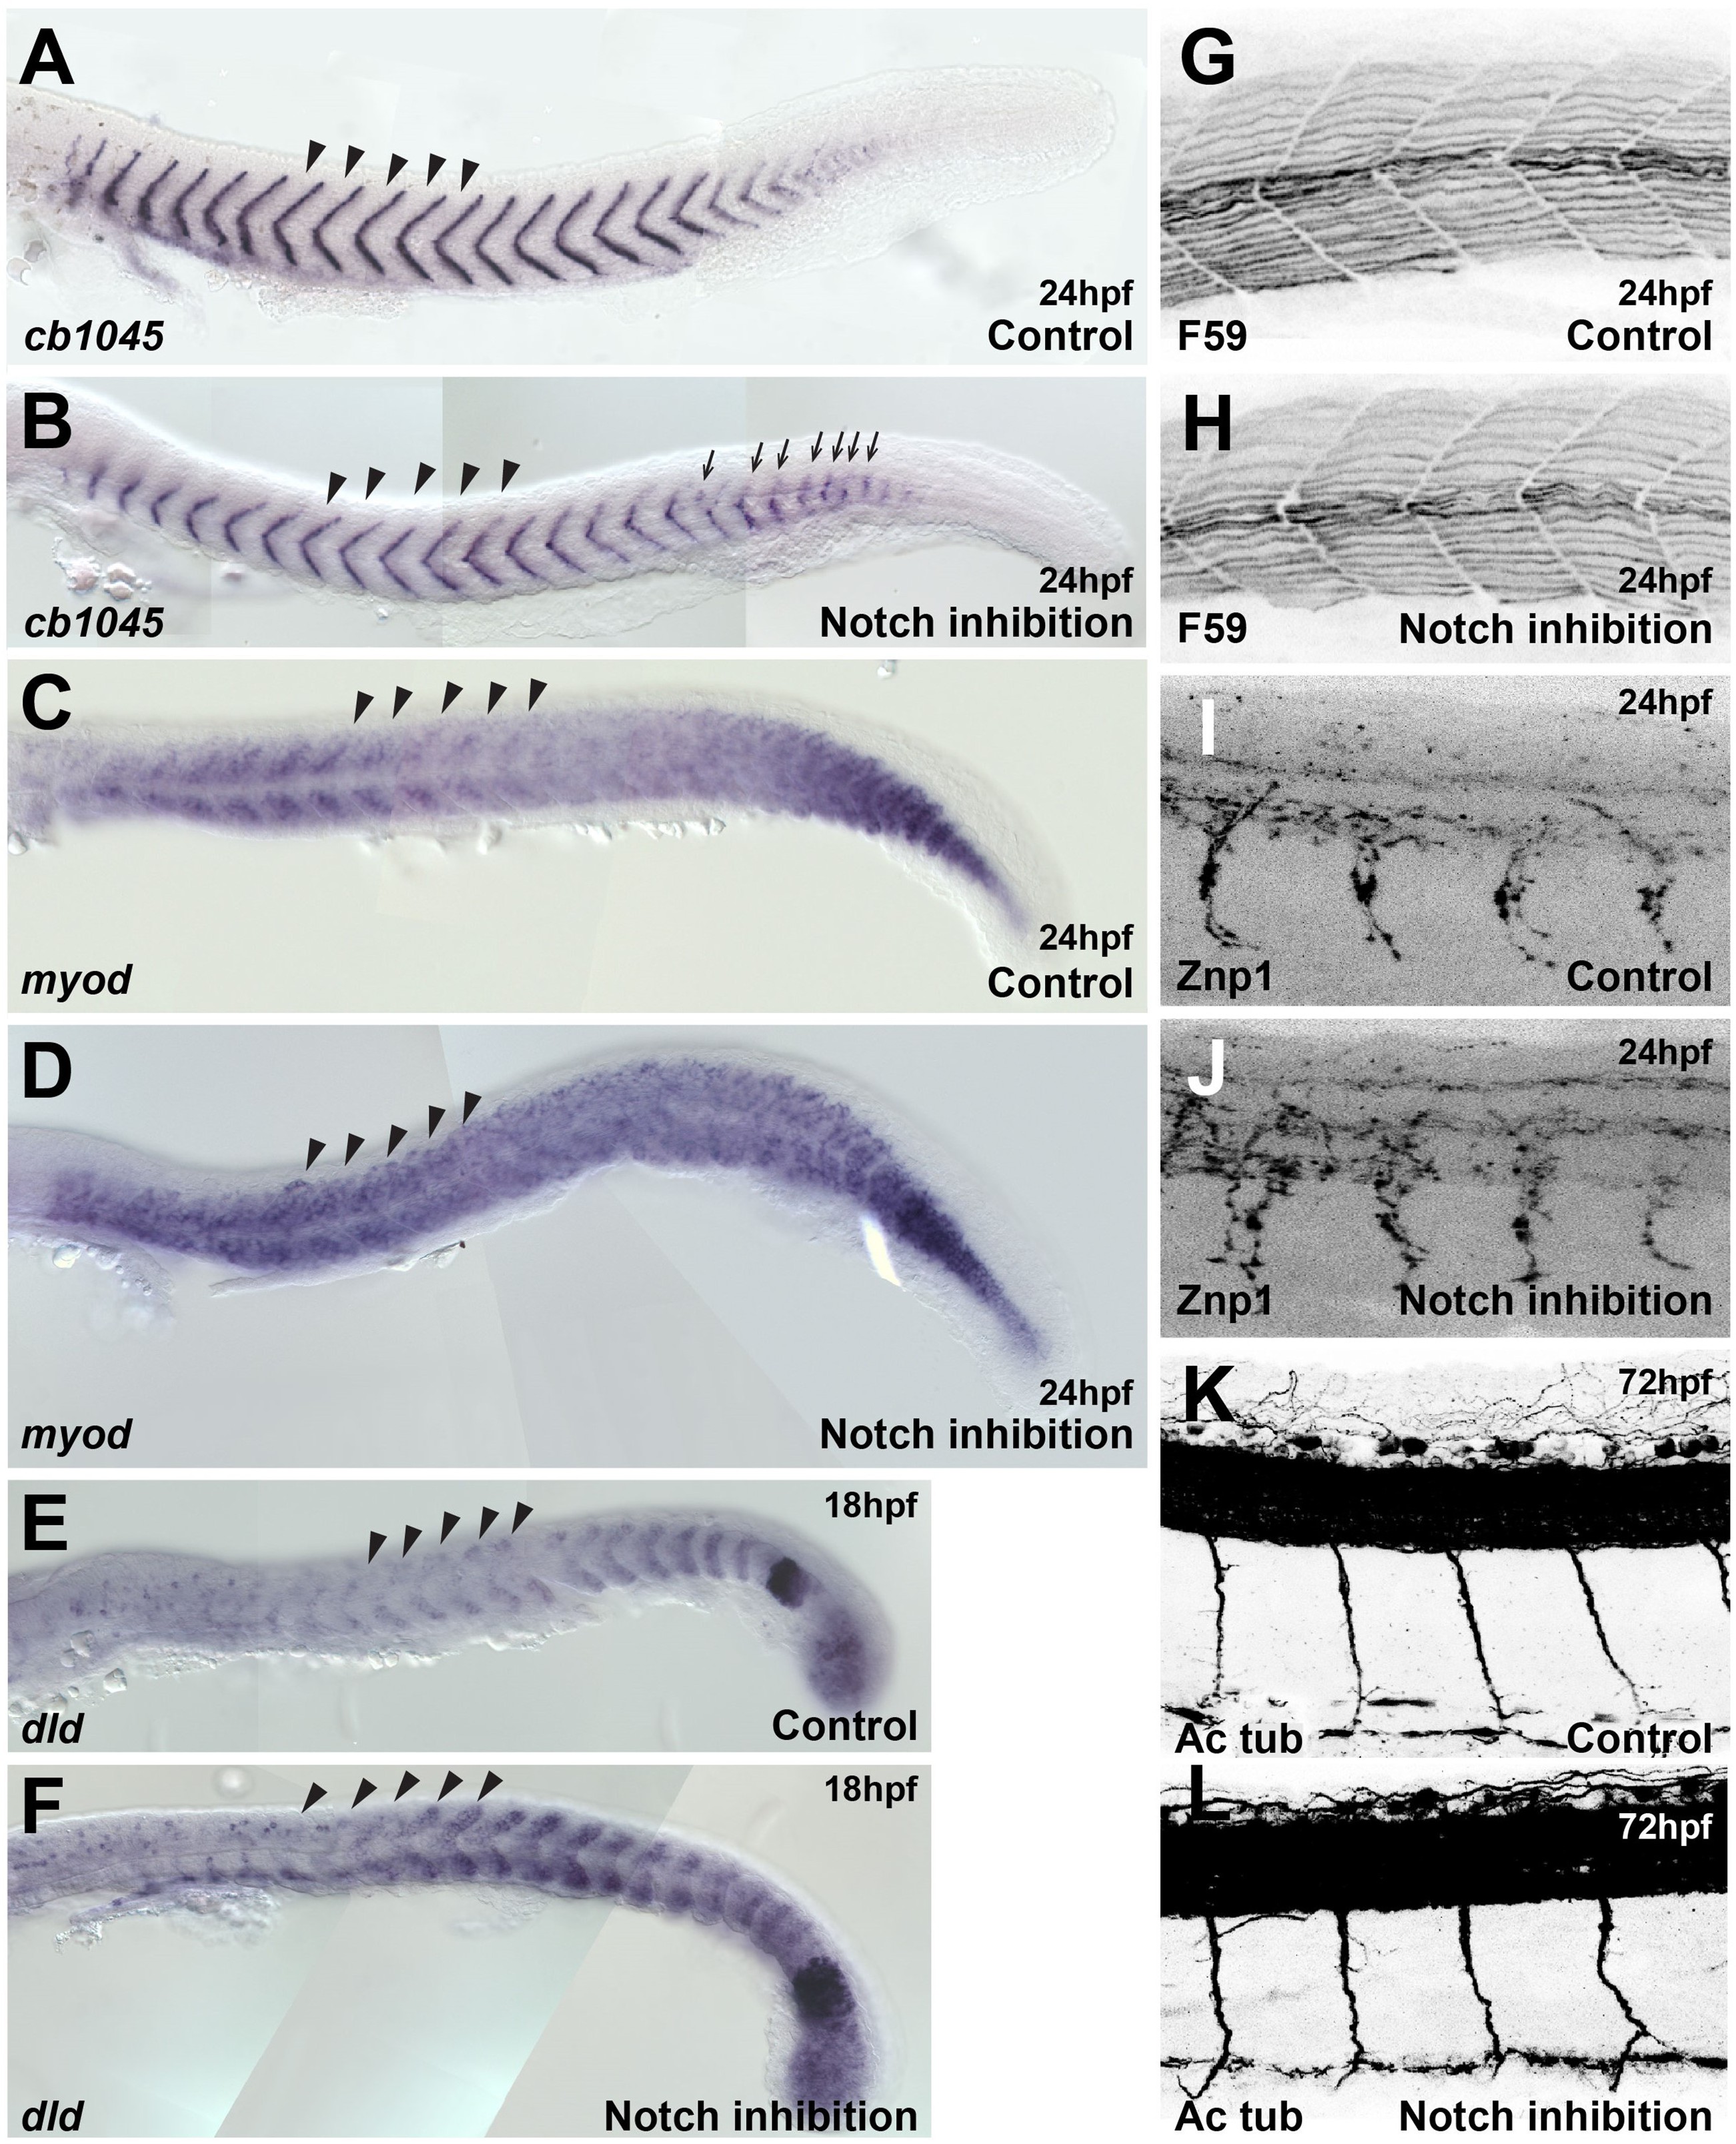
Fig. 4-supplement 1
(A, B) cb1045 in situ hybridisation upon (A) control (DMSO, n = 23) and (B) DAPT (n = 30) treatment. Arrows indicate segmentation defects. (C, D) myod in situ hybridisation upon (C) control (DMSO, n = 47) and (D) DAPT (n = 45) treatment. (E, F) dld (deltaD) in situ hybridisation upon (E) control (DMSO, n = 25) and (F) DAPT (n = 30) treatment. (G, H) Antibody staining for heavy myosin (F59) upon (G) control (DMSO, n = 37) and (H) DAPT (n = 32) treatment. (I, J) Antibody staining for Znp1 upon (I) control (DMSO, n = 35) and (J) DAPT (n = 42) treatment. (K, L) Antibody staining for acetylated tubulin (Ac Tub) upon (K) control (DMSO, n = 20) and (L) DAPT (n = 27) treatment. Arrowheads indicate the level at which trunk neural crest (TNC) migration was analysed. Anterior to the left, dorsal top.
Somites and neural tissue formation are not altered by Notch inhibition.