
|
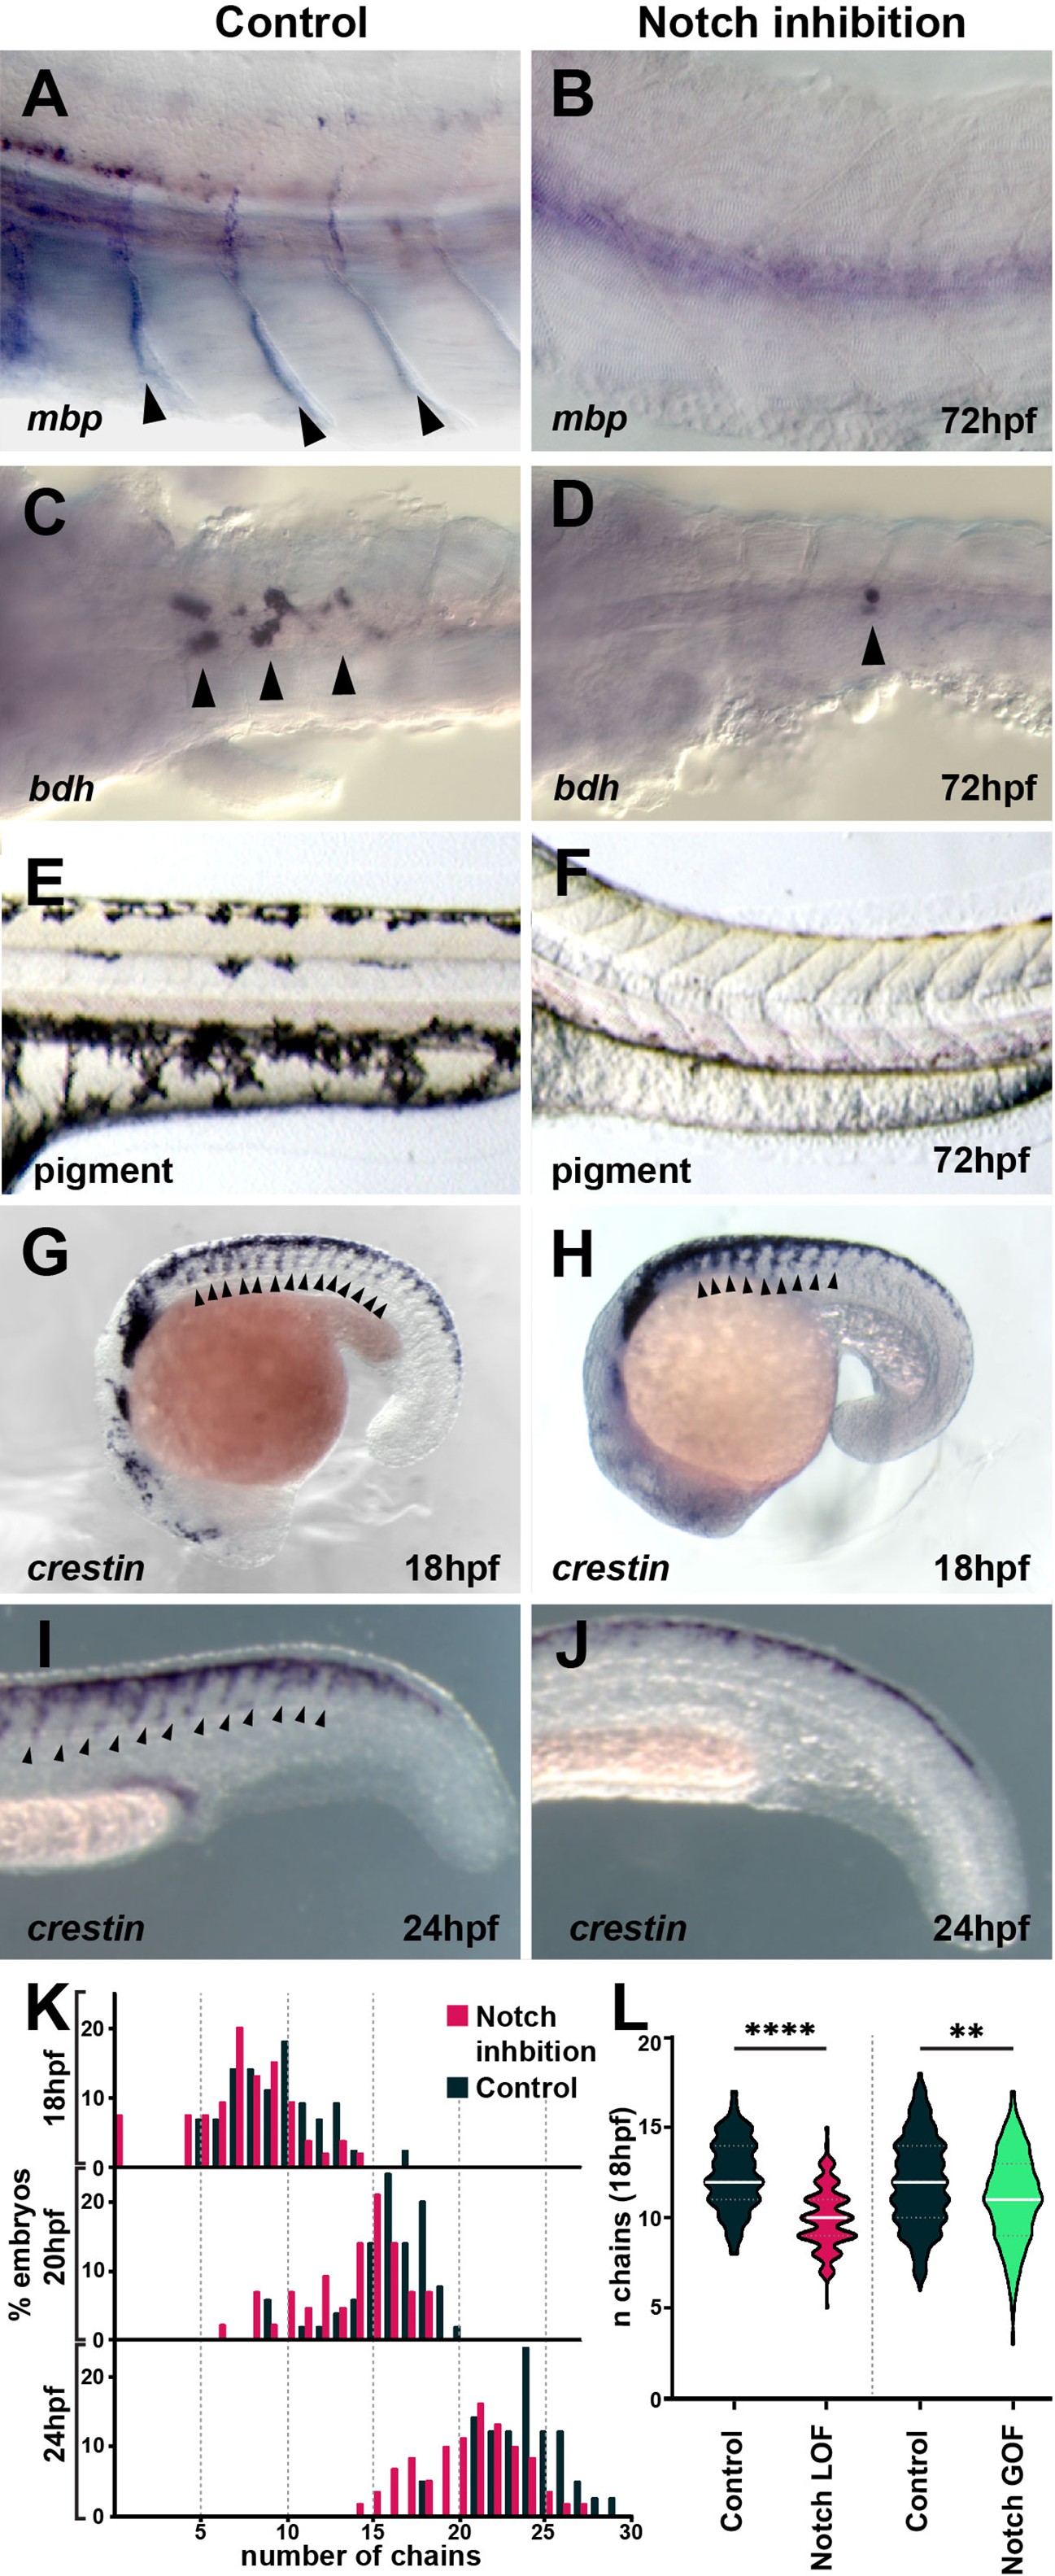
Fig. 3
(A, B) Glial marker mbp in situ hybridisation upon (A) control (DMSO; n = 15) and (B) DAPT (n = 20) treatment from 12 hpf. (C, D) Neuronal marker bdh in situ hybridisation upon (C) control (DMSO; n = 25) and (D) DAPT (n = 18) treatment from 12 hpf. (E, F) Pigmentation upon (E) control (DMSO; n = 40) and (F) DAPT (n = 52) treatment from 12 hpf. (G, H) Neural crest marker crestin in situ hybridisation upon (G) control (DMSO) and (H) DAPT treatment from 12 to 18 hpf. (I, J) crestin in situ hybridisation upon (I) control (DMSO) and (J) DAPT treatment from 12 to 24 hpf. (K) Quantification of migratory chain formation upon control (DMSO) and DAPT treatment from 12 to 18 hpf (DMSO n = 98; DAPT n = 126), 20 hpf (DMSO n = 111; DAPT n = 109), and 24 hpf (DMSO n = 42; DAPT n = 61). (L) Quantification of migratory chain formation in control (HS:Gal4; n = 516), Notch loss of function (LOF) (HS:dnSu(H); n = 220), and gain of function (GOF) conditions (HS:Gal4xUAS:NICD; n = 142) heat shocked at 11 hpf and analysed at 18 hpf. Mann–Whitney U-test, control vs. LOF ****p<0.0001, control vs. GOF **p=0.0020. Anterior to the left, dorsal top, except in (C, D) anterior left, ventral view. Arrowheads indicate gene expression. All treatments performed from 12 hpf.
Notch signalling is required for trunk neural crest (TNC) migration and derivatives formation.