
|
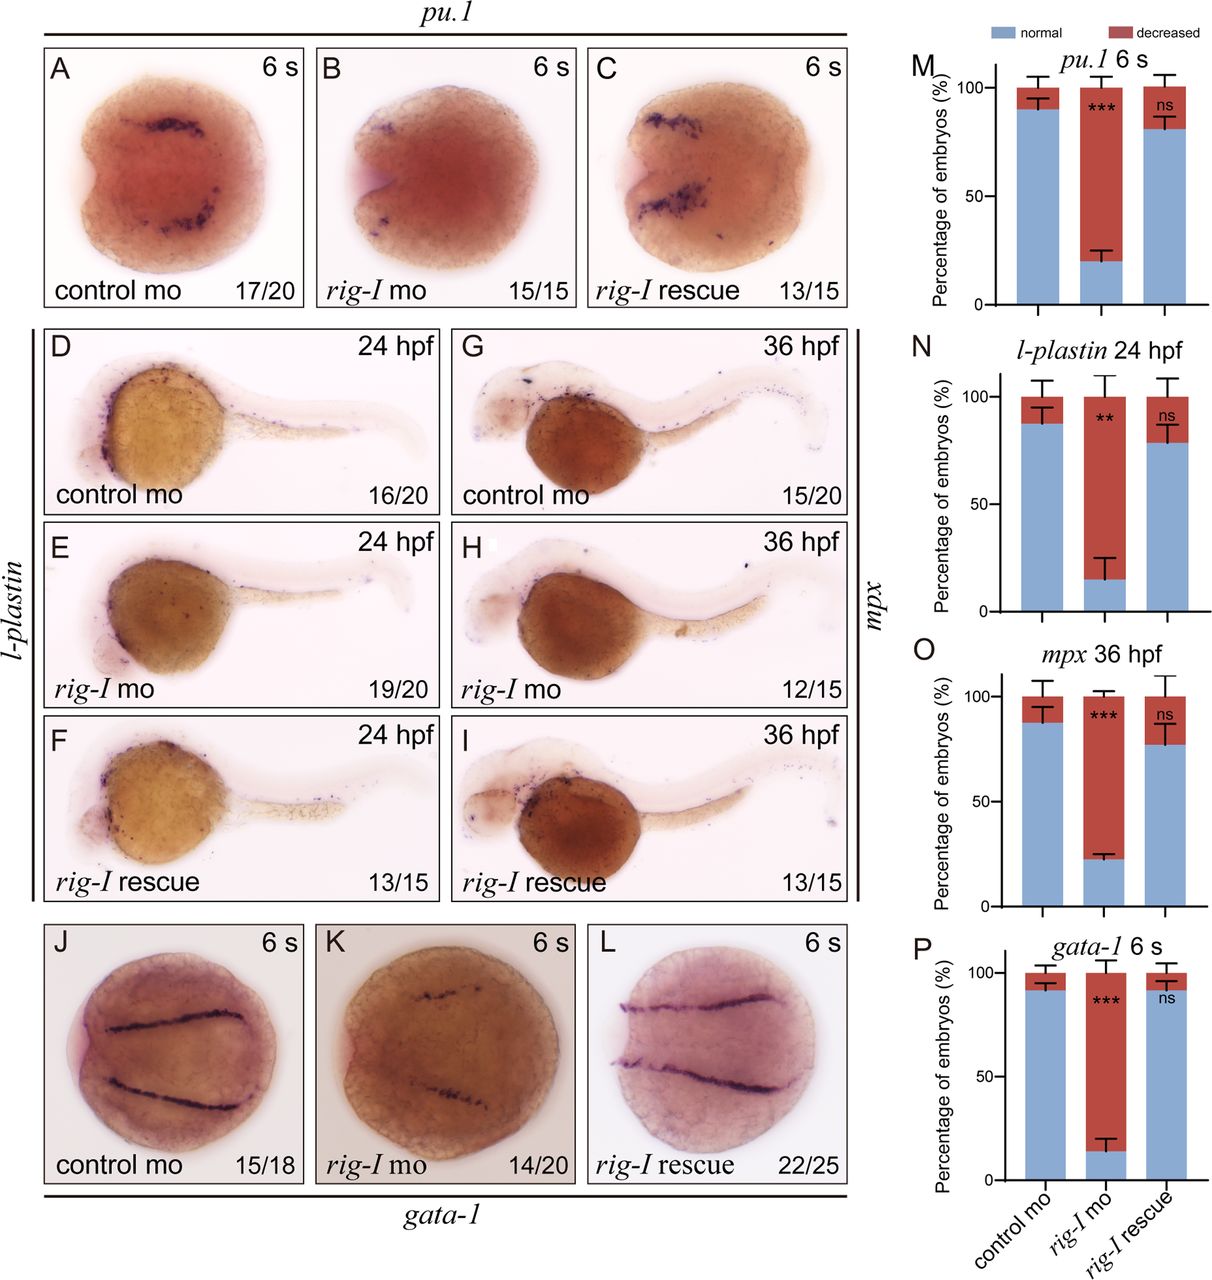
Fig. 3
Effect of rig-I mRNA overexpression on primitive erythropoiesis and myelopoiesis
(A−C) Expression of pu.1/spi1 at the six-somite stage in control MO (A)–, rig-I MO (B)–, or rig-I MO and mRNA (C)–injected embryos from posterodorsal view with anterior to the top. (D−F) Expression of lcp1/l-plastin at 24 hpf in control MO (D)–, rig-I MO (E)–, or rig-I MO and mRNA (F)–injected embryos from lateral view. (G−I) Expression of mpx at 36 hpf in control MO (G)–, rig-I MO (H)–, or rig-I MO and mRNA (I)–injected embryos from lateral view. (J−L) Expression of gata-1 at the six-somite stage in control MO (J)–, rig-I MO (K)–, or rig-I MO and mRNA (L)–injected embryos from posterodorsal view with posterior to the top. Images were captured under Olympus stereoscope (MVX10 MacroView; original magnification ×50). (M−P) Percent of embryos with phenotype of normal or decreased staining intensity in control or rig-I morphant embryos from (A)–(L) based on WISH analysis. The number of embryos used for statistics is shown in each figure. Each experiment was repeated three times (n = 3, mean ± SD, Student t test, **p < 0.01, ***p < 0.001; ns, not significant).