
IMAGE
Fig. 1
- ID
- ZDB-IMAGE-220520-17
- Publication
- Pan et al., 2022 - Gnetum montanum extract induces apoptosis by inhibiting the activation of AKT in SW480 human colon cancer cells
- All Figures
- Figures for Pan et al., 2022
Image
|
Figure Caption
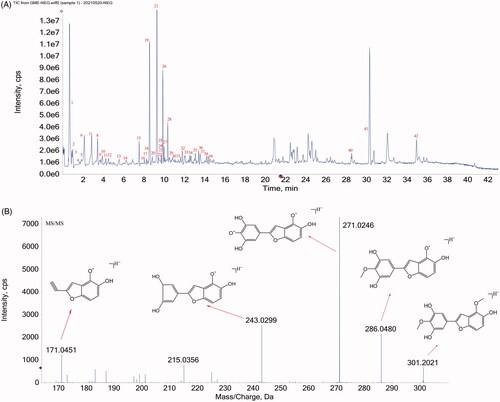
Fig. 1 Figure 1. The phytochemical profile of GME using HPLC-Q-TOF-MS/MS. (A) The base peak chromatogram of GME by LC–MS in negative mode. (B) The secondary fragment ion of gnetifolin A.
Acknowledgments
This image is the copyrighted work of the attributed author or publisher, and
ZFIN has permission only to display this image to its users.
Additional permissions should be obtained from the applicable author or publisher of the image.
Full text @ Pharm Biol