
Image
|
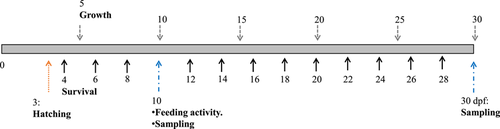
Figure Caption
Fig. 1 Schematic representation of the experimental design indicating the variables analyzed from Day 0 to 30 post fertilization (dpf). The orange dotted arrow indicates the hatching rate measurement at 3 dpf. The continuous black arrows denote the mortality measurement, taken every 2 days from 4 dpf. The grey continuous arrows represent the growth measurement, taken every 5 days from 5 dpf. The blue dotted arrows indicate the sampling points for analyzing gene expression. In addition at 10 dpf, food intake was measured
Acknowledgments
This image is the copyrighted work of the attributed author or publisher, and
ZFIN has permission only to display this image to its users.
Additional permissions should be obtained from the applicable author or publisher of the image.
Full text @ J Exp Zool A Ecol Integr Physiol