IMAGE

Figure 2

ID
ZDB-IMAGE-220511-3
Source
Figures for Miyamoto et al., 2022
Image
Figure Caption

Figure 2

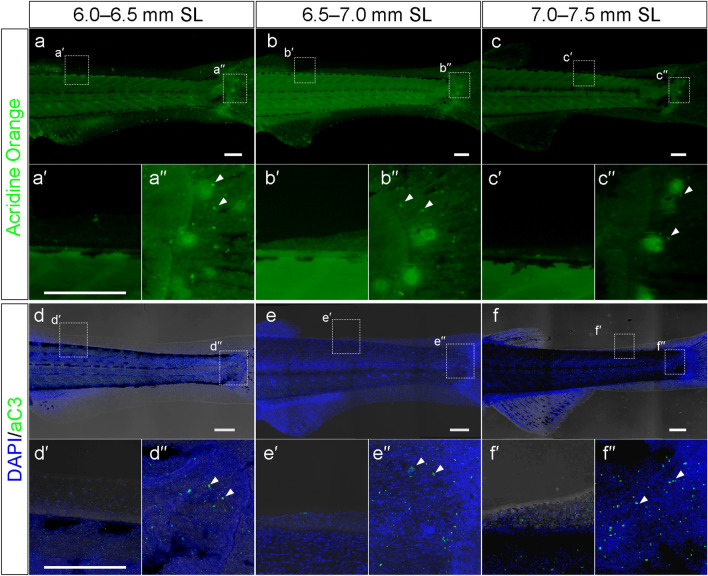
Apoptotic cell death in the reducing LMFF area. (ac’’) Acridine orange staining in the reducing LMFF area (a’,b’,c’) and proximal part of the developing caudal fin region (a”,b”,c”) at 6.0–6.5 mm SL (aa”), 6.5–7.0 mm SL (bb”), and 7.0–7.5 mm SL (cc”). The lower panels (a’,a”,b’,b”,c’,c”) are magnified views of the dashed rectangles in the upper panels (a,b,c), respectively. (df”) Expression pattern of active caspase 3 in the reducing LMFF area (d’,e’,f’) and proximal part of the developing caudal fin region (d”,e”,f”) area at 6.0–6.5 mm SL (dd”), 6.5–7.0 mm SL (ee”), and 7.0–7.5 mm SL (ff”). The lower panels (d’,d”,e’,e”,f’,f”) are magnified views of the dashed rectangles in the upper panels (d,e,f), respectively. Arrowheads in (a”,b”,c”,d”,e”,f”) indicate examples of apoptotic cell death signals. Scale bars indicate 200 μm.

Acknowledgments
This image is the copyrighted work of the attributed author or publisher, and ZFIN has permission only to display this image to its users. Additional permissions should be obtained from the applicable author or publisher of the image. Full text @ Sci. Rep.