IMAGE

Figure 1

ID
ZDB-IMAGE-220511-2
Source
Figures for Miyamoto et al., 2022
Image
Figure Caption

Figure 1

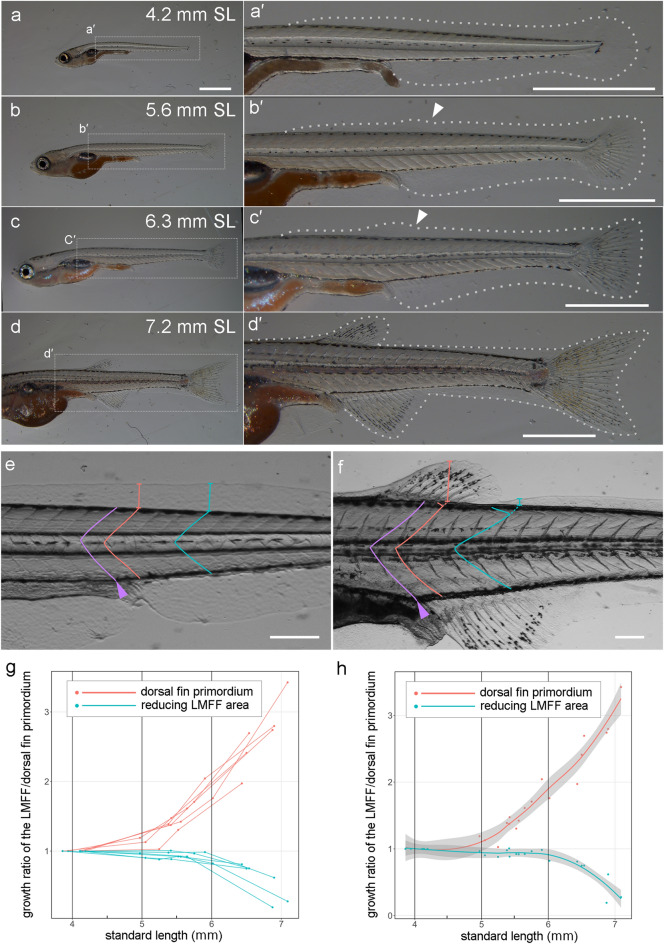
Morphological observation of dorsal fin development and LMFF reduction. (a-d') Gross anatomy of median fin development at 4.2 mm (a,a’), 5.6 mm (b,b’), 6. 3 mm (c,c’), and 7.2 mm (d,d’). The right panels (a’,b’,c’,d’) are magnified views of the dashed rectangles in the left panes (a,b,c,d), respectively. White dashed lines in (a’,b’,c’,d’) indicate outlines of the LMFF. White arrowheads in (b’,c’) indicate protrusion sites of the LMFF. (e,f) Landmark and positions used for measuring the height of the LMFF. To examine the height of the LMFF/dorsal fin primordium at the same position during ontogeny, we used the somite boundary, which is located at the gut tube bending point (purple arrowhead) as a landmark (the first boundary: purple line). Then, we measured two somite boundaries: the next somite boundary from the first boundary (red line) for the future dorsal fin position and the fifth somite boundary (blue lines) for the fin-disappearing positions, respectively. (g,h) Transition of growth ratio of the LMFF/dorsal fin primordium. Each line in (g) indicates temporal transition of the same individual. (h) Local polynomial regression fit of (g). The 95% confidence intervals are indicated as grey areas in (h). Scale bars in (a) and those in (a’,b’,c’,d’,e,f) indicate 1 mm and 200 μm, respectively.

Acknowledgments
This image is the copyrighted work of the attributed author or publisher, and ZFIN has permission only to display this image to its users. Additional permissions should be obtained from the applicable author or publisher of the image. Full text @ Sci. Rep.