
|
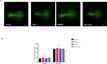
Fig. 4 Fig. 4. Noise-induced inner ear damage of larvae. A) Saccules of 5 dpf larvae. Four groups of tg(Brn3C-gfp) larvae were exposed to 3 different frequencies of noise (200 Hz, 1 kHz, and white noise, 140 dB) for 6 h. B) Number of hair cells in the saccule of each noise-exposed larva. The saccule was divided into 2 regions (anterior: small circular structure positioned at the rostral region; posterior: large circular structure positioned at the caudal region). There were no significant differences between the different frequency-exposed groups in both regions. Scale bar: 20 μm. R: rostral. D: dorsal. n = 40.
Reprinted from Hearing Research, 418, Han, E., Lee, D.H., Park, S., Rah, Y.C., Park, H.C., Choi, J.W., Choi, J., Noise-induced hearing loss in zebrafish model: Characterization of tonotopy and sex-based differences, 108485, Copyright (2022) with permission from Elsevier. Full text @ Hear. Res.