
|
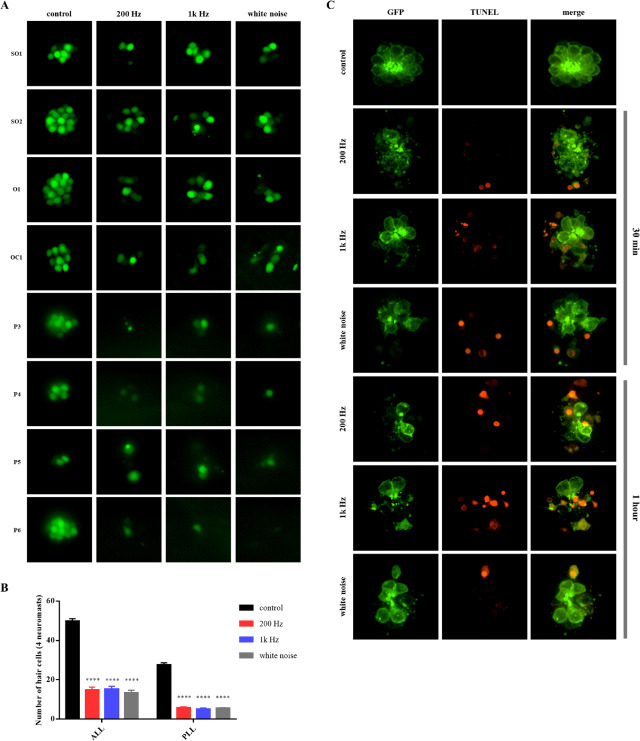
Fig. 3 Fig. 3. Noise-induced lateral line hair cell damage of larvae. A) Fluorescence images of neuromasts of 5 dpf (days post fertilization) larvae after 1 h of noise exposure. Three different frequencies were used to cause noise-induced hair cell damage (200 Hz, 1 kHz, and white noise, 140 dB). Eight neuromasts per larva were imaged for hair cell damage analysis (SO1, SO2, O1, OC1, P3 P4, P5, and P6). B) Mean hair cell number ± standard error of the mean in zebrafish lateral line. Each neuromast was classified as belonging to the ALL (anterior lateral line) or PLL (posterior lateral line), based on its position (ALL: SO1, SO2, O1, and OC1; PLL: P3, P4, P5, and P6). The number of hair cells decreased regardless of noise frequency in all noise-exposed groups. C) Confocal images of terminal deoxynucleotidyl transferase-mediated dUTP-biotin nick-end labeling (TUNEL)-stained neuromast (O1) post-noise exposure. TUNEL-positive cells were detected in the groups exposed for both 30 min and 1 h. n = 30 for each group.
Reprinted from Hearing Research, 418, Han, E., Lee, D.H., Park, S., Rah, Y.C., Park, H.C., Choi, J.W., Choi, J., Noise-induced hearing loss in zebrafish model: Characterization of tonotopy and sex-based differences, 108485, Copyright (2022) with permission from Elsevier. Full text @ Hear. Res.