IMAGE

FIGURE 2

ID
ZDB-IMAGE-220430-27
Source
Figures for Wu et al., 2022
Image
Figure Caption

FIGURE 2

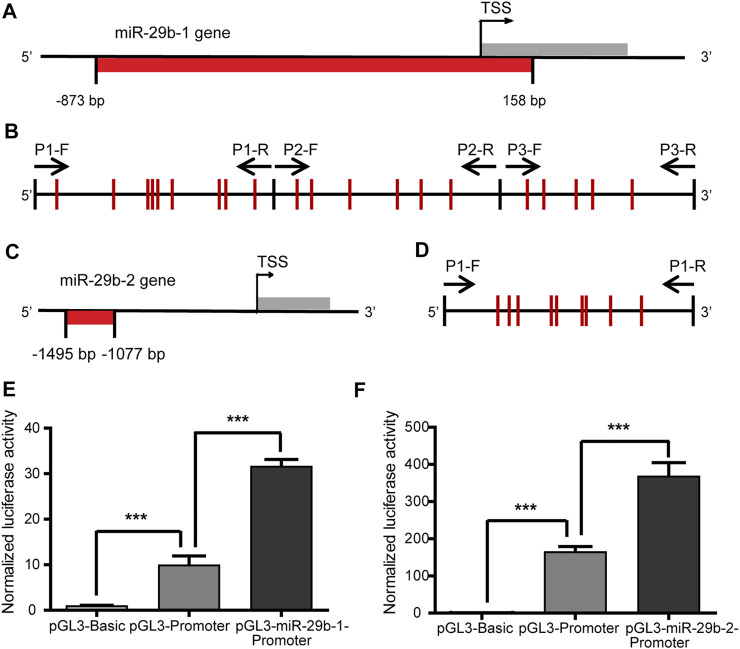
Transcriptional regulatory activity of the miR-29b-1 and miR-29b-2 gene promoters. (A) The location of the CpG sites in the promoter region of the miR-29b-1 gene (−873 bp to +158 bp). (B) The distribution of the CpG sites and three pairs of primers designed for bisulfite sequencing PCR in the promoter region of the miR-29b-1 gene. (C) The location of the CpG sites in the promoter region of the miR-29b-2 gene (−1495 bp to −1077 bp). (D) The distribution of the CpG sites and the primers designed for bisulfite sequencing PCR in the promoter region of the miR-29b-2 gene. (E) The effect of the −873 bp to +158 bp region on the regulation of miR-29b-1 gene promoter transcriptional activity. (F) The effect of the −1407 bp to -1173 bp region on the regulation of miR-29b-2 gene promoter transcriptional activity (***p < 0.001).

Acknowledgments
This image is the copyrighted work of the attributed author or publisher, and ZFIN has permission only to display this image to its users. Additional permissions should be obtained from the applicable author or publisher of the image. Full text @ Front Cell Dev Biol