
Image
|
Figure Caption
Figure 4
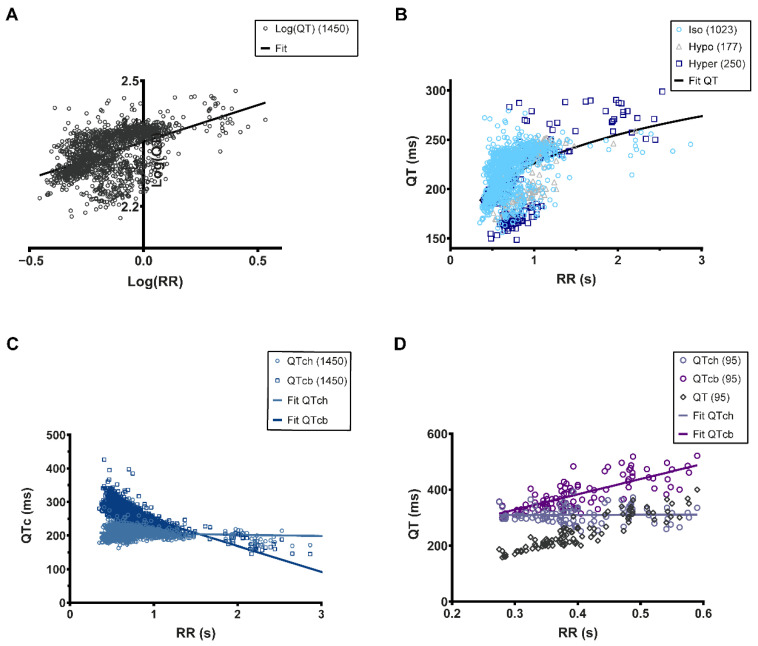
Figure 4. QT-RR relationship fitting. (A), Linear fitting (black line) of the Log(QT)–Log(RR) relationship). The slope of the relationship is 0.2064; (B), Non-linear fitting (black line) of the QT-RR relationship using the characteristics of the fitting shown in (A); (C), QTc-RR relationship using Holzgrefe’s correction formula (QTch) and Bazett’s equation (QTcb). These relationships were linearly fitted (blue-grey line: QTch; navy line: QTcb); (D), QT-RR relationship from the data published in Milan et al., 2006. The QT-RR raw data are in open black diamonds. The QT corrected by the Holzgrefe’s equation, QTch, are lilac opened circles, and the corresponding linear fitting is the lilac line, while the QT corrected by Bazett’s formula are opened purple circles and the corresponding linear fitting if the purple line. The number of individual QT-RR pairs is presented in the upper right corner of each graph.
Acknowledgments
This image is the copyrighted work of the attributed author or publisher, and
ZFIN has permission only to display this image to its users.
Additional permissions should be obtained from the applicable author or publisher of the image.
Full text @ Biology (Basel)