
Image
|
Figure Caption
Figure 2
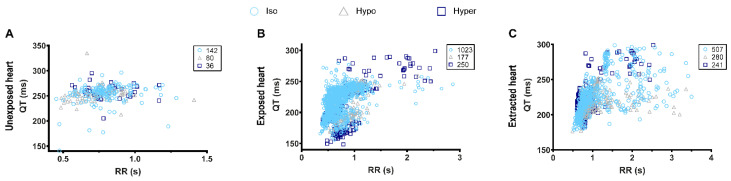
Figure 2. QT-RR relationship in different configurations of ECG measurement. (A), Unexposed heart; (B), exposed heart; (C), extracted heart. The number of individual QT-RR pairs, obtained in isosmotic, hyposmotic, and hyperosmotic conditions, is presented in the upper right corner of each graph and was obtain from n = 3 (unexposed heart), n = 10 (exposed heart), and n = 6 (extracted heart) adult zebrafish.
Acknowledgments
This image is the copyrighted work of the attributed author or publisher, and
ZFIN has permission only to display this image to its users.
Additional permissions should be obtained from the applicable author or publisher of the image.
Full text @ Biology (Basel)