
Image
|
Figure Caption
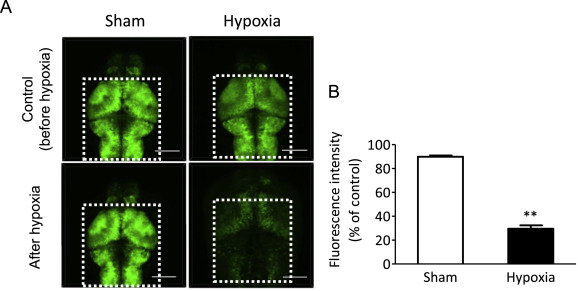
Fig. 3 Hypoxia induced neuronal cell damage in zebrafish larvae. (A) Following hypoxia, they were maintained in normoxic E3 medium for 24 h. Fluorescence intensity of Kaede was measured before hypoxia and 24 h after normoxic condition. The fluorescence intensity of Kaede was measured in white dots area of the brain. (B) The effect of hypoxia on neuronal cell damage. Fluorescence intensity (% control) = After hypoxia/Control (before hypoxia). Scale bar = 100 μm n = 11–12. ∗∗P < 0.01 vs control.
Figure Data
Acknowledgments
This image is the copyrighted work of the attributed author or publisher, and
ZFIN has permission only to display this image to its users.
Additional permissions should be obtained from the applicable author or publisher of the image.
Full text @ J. Pharmacol. Sci.