
Image
|
Figure Caption
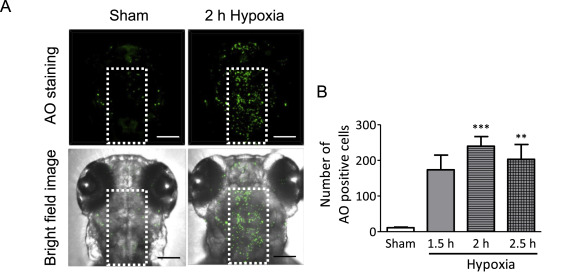
Fig. 2 Hypoxia induced cell death in the brain of zebrafish larvae. (A) Following hypoxia, larvae were maintained in normoxic E3 medium for 24 h, and subsequently stained with acridine orange (AO). AO positive cells were counted in white dots area of the brain except near the eyes to detect dead cells in the brain. (B) The effect of hypoxia on cell death in the brain. Scale bar = 100 μm n = 4–25. ∗∗P < 0.01, ∗∗∗P < 0.001 vs sham.
Figure Data
Acknowledgments
This image is the copyrighted work of the attributed author or publisher, and
ZFIN has permission only to display this image to its users.
Additional permissions should be obtained from the applicable author or publisher of the image.
Full text @ J. Pharmacol. Sci.