IMAGE

FIGURE 1

ID
ZDB-IMAGE-220420-17
Genes
Source
Figures for Zheng et al., 2022
Image
Figure Caption

FIGURE 1

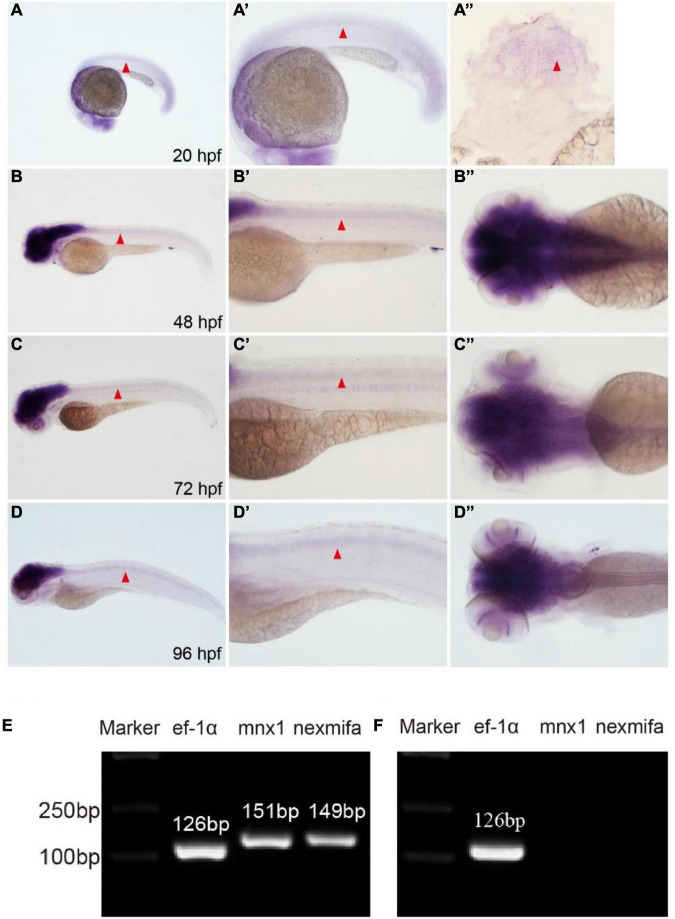
Nexmifa expression analysis in spinal cord and motor neurons. (A) At 20 hpf, in situ hybridization nexmifa signals are localized in brain and spinal cord (lateral view). (A’) Partially magnified image of (A). (A”) The trunk transverse section of the embryo. (B) At 48 hpf, in situ hybridization nexmifa signals are localized in the brain and spinal cord (lateral view). (B’) Partially magnified image of (B). (B”) Dorsal view of the brain. (C) At 72 hpf, in situ hybridization nexmifa signals are localized in the brain and spinal cord (lateral view). (C’) Partially magnified image of (C). (C”) Dorsal view of the brain. (D) At 96 hpf, in situ hybridization nexmifa signals are localized in the brain and spinal cord (lateral view). (D’) Partially magnified image of (D). (D”) Dorsal view of the brain. (E) RT-PCR results on mnx1-GFP sorted cells. Nexmifa is expressed in selected neuron cells from the Tg (mnx1: EGFP) line. (F) The result of the RT-PCR on Kdrl-EGFP sorted cells. No signals of nexmifa and mnx1 are detected in the GFP-positive cells sorted from the Tg(kdrl:EGFP) line.

Figure Data
Acknowledgments
This image is the copyrighted work of the attributed author or publisher, and ZFIN has permission only to display this image to its users. Additional permissions should be obtained from the applicable author or publisher of the image. Full text @ Front. Mol. Neurosci.