
|
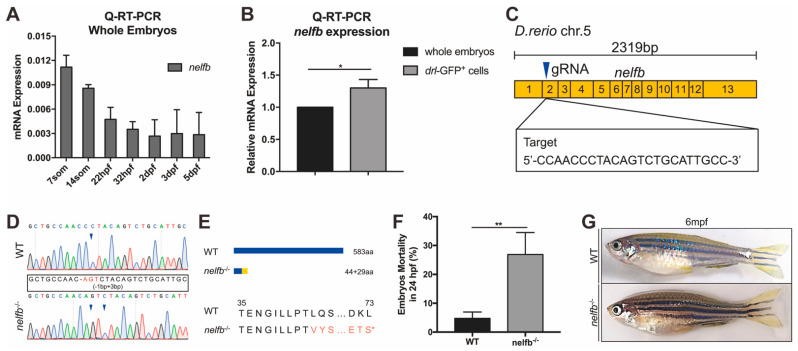
Figure 1 Expression of nelfb during development and generation of zebrafish nelfb mutants. (A) Q-RT-PCR analysis of whole embryos to show the expression of nelfb at different stages. The relative expression of nelfb is normalized to the expression of β-actin. (B) Q-RT-PCR analysis of the relative expression of nelfb in sorted drl-GFP+ cells compared with the whole embryo lysates at 24 hpf. (C) The schematic diagram of nelfb cDNA and the targeted region of guide RNA. The target DNA sequence is shown in the rectangle. (D) Sanger sequencing analysis of PCR fragments containing the gRNA targeted region from WT and nelfb deficient homozygotes. The deleted nucleotides are replaced by -, and the inserted nucleotides are in red, as shown in the rectangle. (E) Schematic representation and amino acid sequences of the wild type Nelfb and the predicted truncated protein. (F) The mortality rate of embryos at 24 hpf (n = 100–300 embryos per group). (G) Images of adult zebrafish at 6 mpf. All results are presented as the mean ± SD from three independent experiments (t test, * for p < 0.05, ** for p < 0.01). WT, wildtype; hpf, hours post-fertilization; mpf, months post-fertilization.