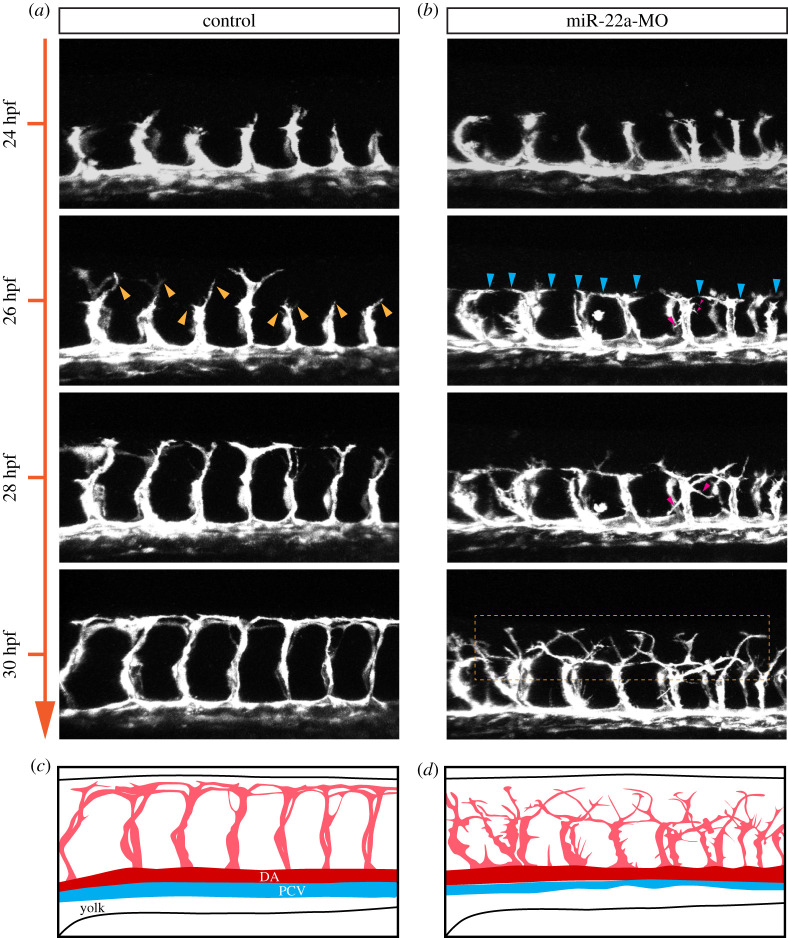
IMAGE

Figure 2.

ID
ZDB-IMAGE-220411-6
Source
Figures for Sheng et al., 2022
Image
Figure Caption

Figure 2.

miR-22a regulates ISV tip cell behaviour. (a,b) Still images from in vivo time-lapse imaging analysis of Tg(kdrl:EGFP) embryos with HD detection setting. Time stages (hpf) are noted at the left side. The yellow arrows indicate the upward tip cells in the control groups. The blue arrows indicate the lateral tip cells. The red arrows indicate the downward tip cells. The rectangle box in dash line indicates the multidirectional filopodial extensions in the miR-22a deficiency embryos. (c,d) Diagrams of ISV morphology in control and miR-22a MO-injected embryos.

Acknowledgments
This image is the copyrighted work of the attributed author or publisher, and ZFIN has permission only to display this image to its users. Additional permissions should be obtained from the applicable author or publisher of the image. Full text @ Open Biol.