
Image
|
Figure Caption
Figure 6
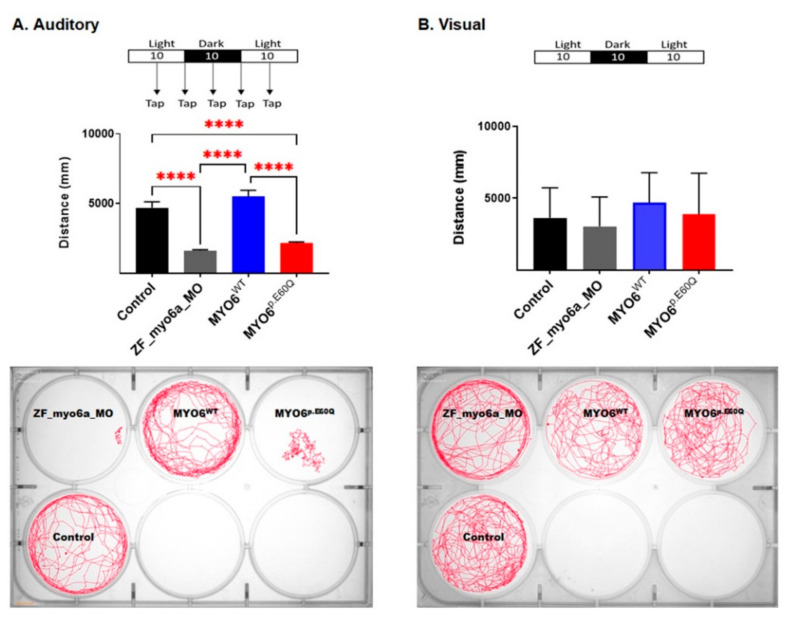
Figure 6. Auditory-sensory behavioral response in zebrafish larvae was examined by assessing locomotive behavior recorded through the presentation of light–dark cycles over time intervals of 30 min and tapping. The total distance moved by zebrafish larvae was calculated using Ethovision software (Noldus). (A). Auditory-sensory behavioral response. (B). Visual-sensory behavioral response. Representative behavior and response activity to auditory-sensory stimuli of zebrafish groups measuring movements over time for the examined zebrafish groups; movement is shown by the drawn red lines. The number of experiments n = 4; values represent mean with standard deviation. Statistical analysis was performed with one-way ANOVA followed by Tukey’s multiple tests for multiple comparisons, **** p < 0.0001.
Figure Data
Acknowledgments
This image is the copyrighted work of the attributed author or publisher, and
ZFIN has permission only to display this image to its users.
Additional permissions should be obtained from the applicable author or publisher of the image.
Full text @ Int. J. Mol. Sci.