
|
Figure 5
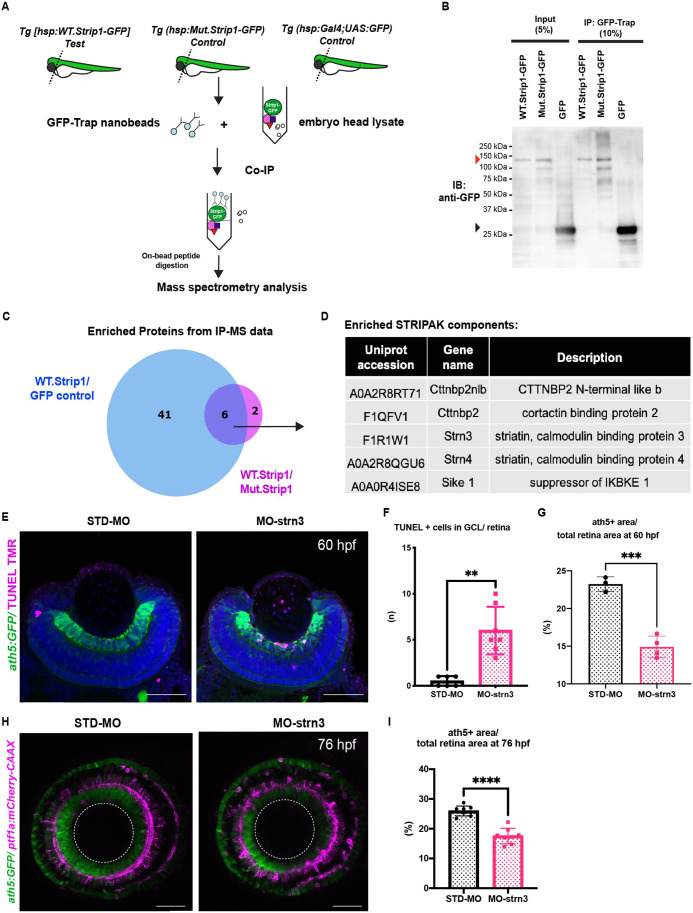
(A) Design of co-immunoprecipitation coupled with mass spectrometry (Co-IP/MS) to identify zebrafish Strip1-interacting partners. Embryos carrying the transgenes Tg[hsp:WT.Strip1-GFP], Tg[hsp:Mut.Strip1-GFP], or Tg[hsp:Gal4;UAS:GFP] were used to pull-down wild-type GFP-tagged Strip1, mutant GFP-tagged Strip1 or only GFP, respectively. Head lysates from 2-dpf zebrafish embryos were subjected to immunoprecipitation using GFP-Trap beads. Immunoprecipitates were digested and analyzed by mass spectrometry (MS). (B) Western blotting of whole head lysates (input) and immunoprecipitates (IP) using anti-GFP antibody. Red and black arrowheads indicate the expected band sizes for Strip1-GFP (120 kDa) and GFP (26 kDa), respectively. (C) Venn diagram comparing proteins significantly enriched in WT.Strip1-GFP relative to Control GFP (blue) and WT.Strip1-GFP relative to Mut.Strip1-GFP (magenta). Six proteins are commonly enriched in both groups, FC >2, p < 0.05. n = 3 for WT.Strip1-GFP and Mut. Strip1-GFP and n = 2 for GFP-control. (D) Five components of the STRIPAK complex found from six proteins commonly enriched in (C). (E) Transferase dUTP nick end labeling (TUNEL) of 60-hpf retinas of Tg[ath5:GFP] transgenic embryos injected with standard MO and MO-strn3. RGCs and apoptotic cells are labeled with ath5:GFP and TUNEL, respectively. Nuclei are stained with Hoechst (blue). (F) The number of TUNEL+ cells in ganglion cell layer (GCL). Mann–Whitney U-test, n ≥ 6. (G) Percentage of ath5+ area relative to total retinal area. Student’s t-test with Welch’s correction, n ≥ 3.(H) Confocal images of retinas of 76-hpf Tg[ath5:GFP; ptf1a:mCherry-CAAX] transgenic embryos injected with standard MO and MO-strn3. ath5:GFP and ptf1a:mCherry-CAAX label RGCs and amacrine cells (ACs), respectively. (I) Percentage of ath5+ area relative to total retinal area. Student’s t-test with Welch’s correction, n = 8. Scale bar, 50 μm (E, H). For all graphs, data are represented as means ± standard deviation (SD). **p < 0.01, ***p < 0.001, and ****p < 0.0001.
Strn3 is a Strip1-interacting partner that promotes retinal ganglion cell (RGC) survival.