
|
Figure 2
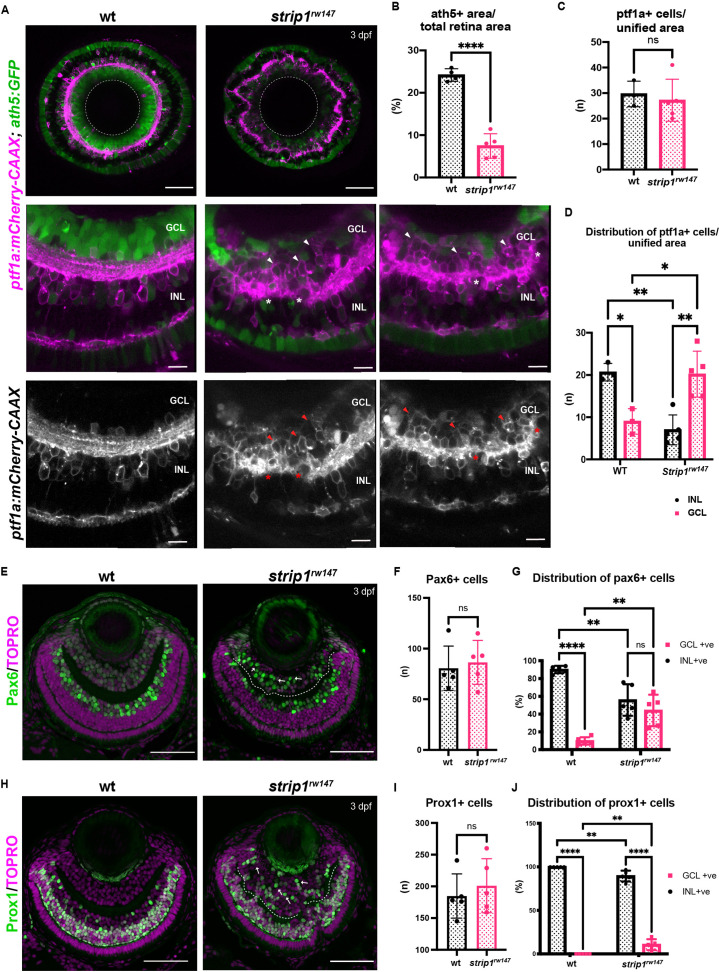
(A) Confocal sections of wild-type and strip1rw147 mutant retinas combined with the transgenic line Tg[ath5:GFP; ptf1a:mCherry-CAAX] to label RGCs and amacrine cells (ACs). Middle panels represent higher magnification. Lower panels show the magenta channel. Arrowheads indicate abnormal positioning of ptf1a+ ACs in the GCL. Asterisks show AC dendritic patterning defects. INL, inner nuclear layer; GCL, retinal ganglion cell layer. Scale bars, 50 μm (upper panels) and 10 μm (middle and lower panels). (B) Percentage of ath5+ area relative to total retinal area. Student’s t-test with Welch’s correction, n ≥ 4. (C) AC numbers per unified retinal area (8500 μm2). Student’s t-test with Welch’s correction, n ≥ 3. (D) Distribution of ACs (GCL or INL) per unified retinal area (8500 μm2). Two-way analysis of variance (ANOVA) with the Tukey multiple comparison test, n ≥ 3. (E) Wild-type and strip1rw147 mutant retinas at 3 dpf labeled with anti-Pax6 antibody which strongly labels ACs. Arrows indicate strong Pax6+ cells that infiltrate the GCL. Nuclei are stained with TOPRO3. Scale bar, 50 μm. (F) The number of strong Pax6+ cells per retina. Student’s t-test with Welch’s correction, n = 5. (G) Percentage of strong Pax6+ cells (GCL+ or INL+) to the total number of strong Pax6+ cells. Two-way ANOVA with the Tukey multiple comparison test, n = 5. (H) Wild-type and strip1rw147 mutant retinas at 3 dpf labeled with anti-Prox1 antibody. Arrows indicate Prox1+ cells that infiltrate the GCL. Nuclei are stained with TOPRO3. Scale bar, 50 μm. (I) The number of Prox1+ cells per retina. Student’s t-test with Welch’s correction, n = 5. (J) Percentage of Prox1+ cells (GCL+ or INL+) to the total number of Prox1+ cells. Two-way ANOVA with the Tukey multiple comparison test, n = 5. For all graphs, data are represented as means ± standard deviation (SD). ns, not significant, *p < 0.05, **p < 0.01, and ****p < 0.0001.
Retinal ganglion cells (RGCs) are reduced and INL cells infiltrate the GCL in strip1 mutants.