
Fig 7
- ID
- ZDB-IMAGE-220325-10
- Publication
- Lu et al., 2022 - mTOR activity is essential for retinal pigment epithelium regeneration in zebrafish
- All Figures
- Figures for Lu et al., 2022
|
Fig 7
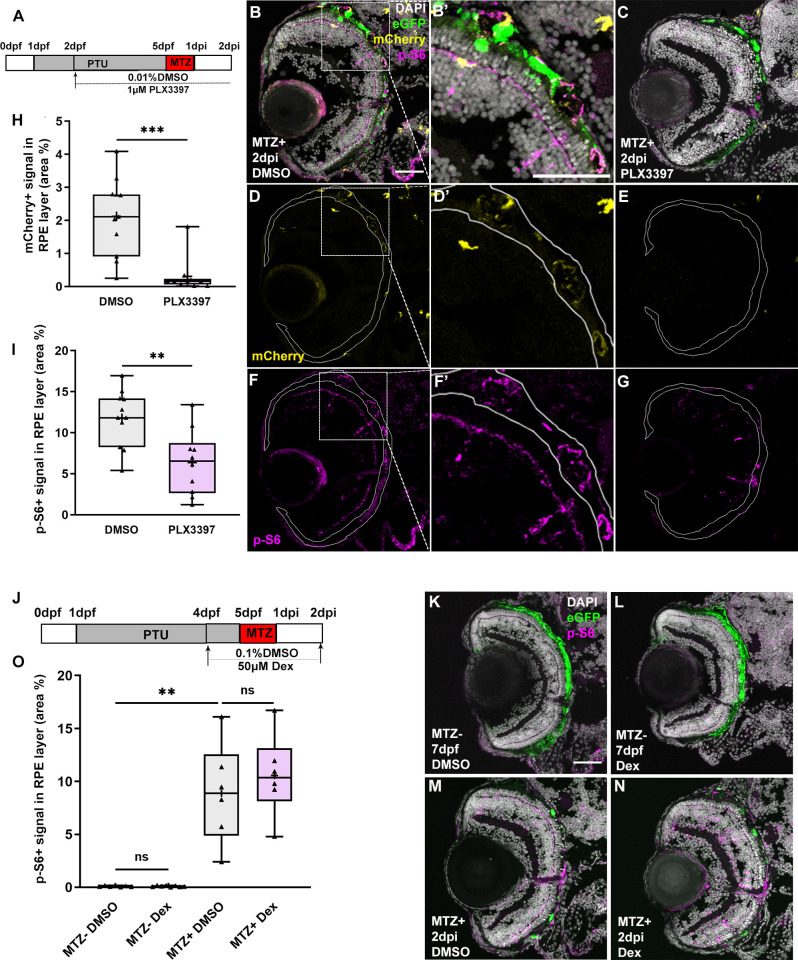
(A,J) Schematic of the experimental paradigm showing the timeline for chemical treatments and ablation on transgenic larvae (mpeg1:mCherry;rpe65a:nfsB-eGFP). (B-G) MTZ+ DMSO- and PLX3397-treated larvae at 2dpi. Single channel immunofluorescent images of mCherry (D,E) and p-S6 (F,G) are shown. (B’,D’,F’) are high-magnification images showing the colocalization of p-S6 and mCherry. Nuclei (white), eGFP (green), p-S6 (magenta), mCherry (yellow). (H) Quantification of mCherry signal in the RPE layer showed a significant depletion of mCherry+ macrophages/microglia in the RPE after PLX3397 treatment in MTZ+ larvae, compared to DMSO-treated controls. (I) Quantification of p-S6 levels in the RPE layer showed a significant decrease in PLX3397-treated larvae, when compared to DMSO-treated controls. (K-N) Fluorescent images of p-S6 immunostaining on cryosections from MTZ- and MTZ+ DMSO- and Dex-treated larvae at 7dpf/2dpi. Nuclei (white), eGFP (green), p-S6 (magenta). (O) Quantification of p-S6 level in the RPE layer showed a significant increase in MTZ+ DMSO-treated larvae when compared to MTZ- DMSO-treated control, but no significant differences between Dex-treated and DMSO-treated larvae from MTZ- or MTZ+ groups. p-values: ** ≤ 0.01, *** ≤ 0.001. Statistical information can be found in S9 Table. Dorsal is up and distal is left. Scale bar = 50μm.