
|
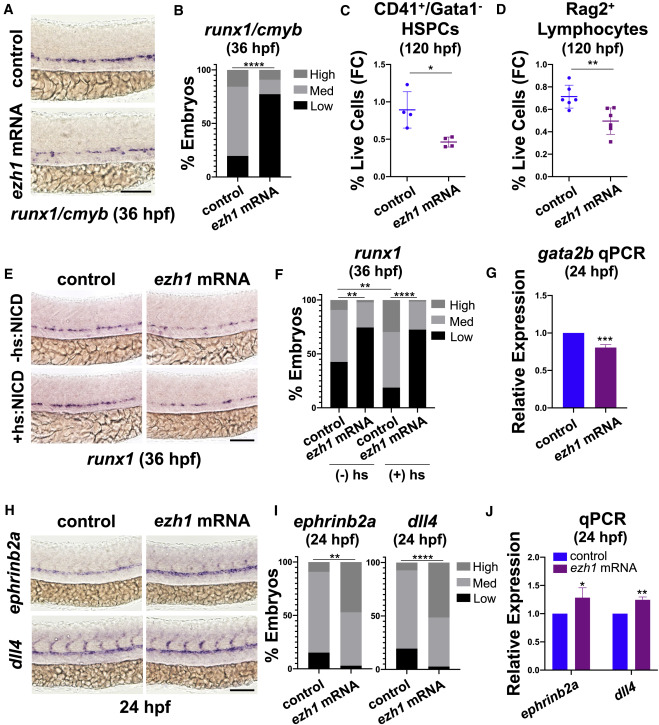
Fig. 6 (A) WISH for runx1/cmyb at 36 hpf in control and ezh1 mRNA-injected embryos. Scale bar, 100 μm. (B) Qualitative phenotypic distribution plot of embryos in (A) (n = 51 control, 44 ezh1 mRNA-injected embryos; ∗∗∗∗p < 0.0001). (C) Flow cytometry (FC) on CD41:GFP+/Gata1:dsRed− gated on percentage of live cells at 120 hpf in control and ezh1 mRNA-injected embryos (n = 5 embryos/sample × 4 biological replicates; two-tailed unpaired Student's t test, ∗p < 0.05. Error bars indicate SD). (D) Flow cytometry (FC) for Rag2:GFP+ gated on percentage of live cells at 120 hpf in control and ezh1 mRNA-injected embryos (n = 5 embryos/sample × 6 biological replicates; two-tailed unpaired Student's t test, ∗∗p < 0.01. Error bars indicate SD). (E) WISH for runx1 at 36 hpf in control and ezh1 mRNA-injected Hsp70:NICD embryos ± heat shock at 30 hpf. Scale bar, 100 μm. (F) Qualitative phenotypic distribution plot of embryos in (E) (n ≥ 47 embryos/condition; ∗∗p < 0.01, ∗∗∗∗p < 0.0001). (G) Whole-embryo gata2b qPCR on control and ezh1 mRNA-injected embryos at 24 hpf relative to 18s (n ≥ 25 embryos/sample × 3 replicate clutches; two-tailed unpaired Student's t test, ∗∗∗p < 0.001. Mean ± SEM). (H) WISH for ephrinb2a and dll4 at 24 hpf in control and ezh1 mRNA-injected embryos. Scale bar, 100 μm. (I) Qualitative phenotypic distribution plot of embryos in (H) (n ≥ 33 embryos/condition; ∗∗p < 0.01, ∗∗∗∗p < 0.0001). (J) Whole-embryo ephrinb2a and dll4 qPCR on control and ezh1 mRNA-injected embryos at 24 hpf relative to 18s (n ≥ 25 embryos/sample × 3 replicate clutches; two-tailed unpaired Student's t test, ∗p < 0.05, ∗∗p < 0.01. Mean ± SEM).