
Image
|
Figure Caption
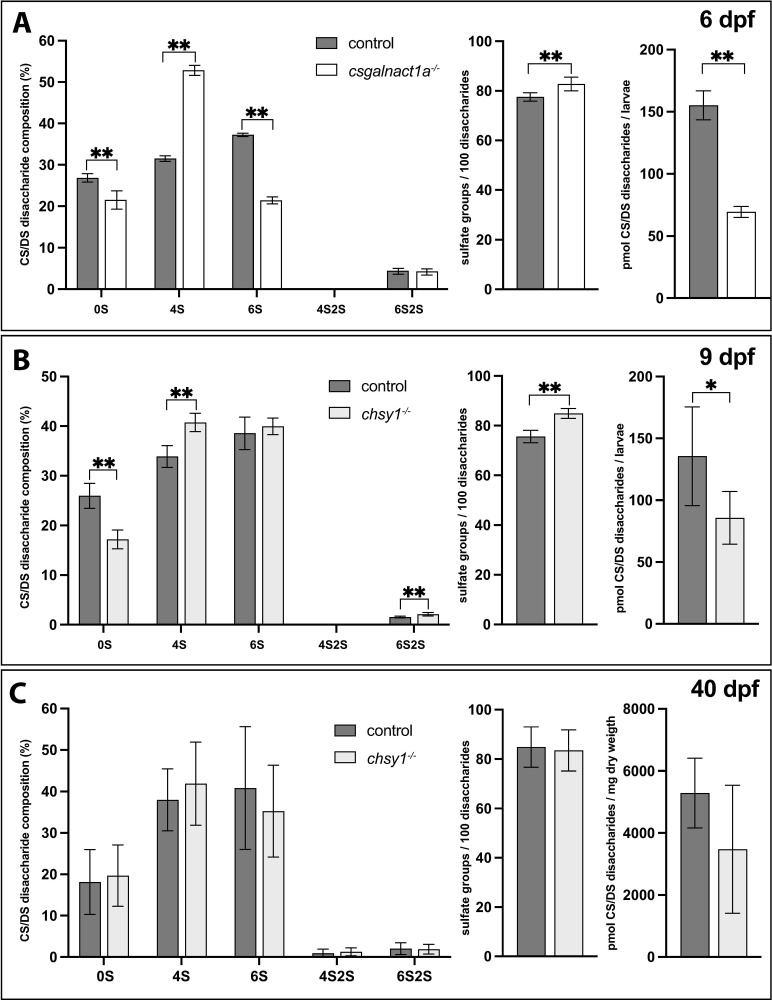
Fig 7
RPIP-HPLC analysis shows the CS/DS disaccharide composition (left charts), total sulfate group content/100 disaccharides (middle charts) and amount of CS/DS (right charts) for 6 dpf larvae (A), 9 dpf larvae (B) and 40 dpf juveniles (C). Statistical significances are indicated with * for p-values <0.05 and ** for p-values <0.005. Disaccharide species abbreviated as 0S (ΔHexA- GalNAc/ΔHexA-GlcNAc), 4S (ΔHexA-GalNAc4S), 6S (ΔHexA-GalNAc6S), 4S2S (ΔHexA2S-GalNAc4S), and 6S2S (ΔHexA2S-GalNAc6S).
Acknowledgments
This image is the copyrighted work of the attributed author or publisher, and
ZFIN has permission only to display this image to its users.
Additional permissions should be obtained from the applicable author or publisher of the image.
Full text @ PLoS Genet.