IMAGE

FIGURE 3

ID
ZDB-IMAGE-220303-29
Source
Figures for Li et al., 2022
Image
Figure Caption

FIGURE 3

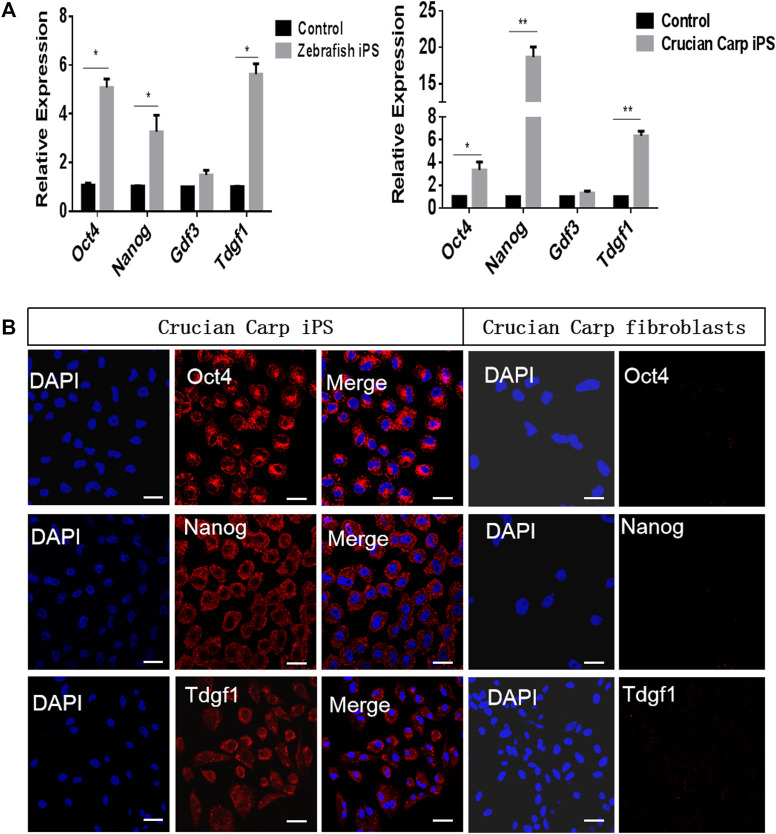
Expression pattern of pluripotent candidate genes in iPS-like cells from zebrafish and crucian carp. (A) qRT-PCR analyse of pluripotent candidate genes in iPS-like cells from zebrafish (left) and crucian carp (right). The fibroblasts from zebrafish and crucian as control, respectively. It was showed that the mRNA levels of Oct4, Nanog, and Tdgf1 were higher in the iPS-like cells of zebrafish and crucian carp, while the expression level of Gdf3 was lower. (B) Immunofluorescence staining of Oct4, Nanog, and Tdgf1 iPS-like cells (passage 15) from crucian carp (Scale bars represent 20 μm). It was showed that the expression was positive in iPS-like cells, but not in fibroblasts. Data are shown as mean ± SD of values obtained from three independent experiments, and significant differences were evaluated using Student’s t test (*p < .005; **p < .001). The scale bars are equal to 20 μm.

Acknowledgments
This image is the copyrighted work of the attributed author or publisher, and ZFIN has permission only to display this image to its users. Additional permissions should be obtained from the applicable author or publisher of the image. Full text @ Front Genet