IMAGE

Figure 1

ID
ZDB-IMAGE-220303-11
Source
Figures for Benardais et al., 2022
Image
Figure Caption

Figure 1

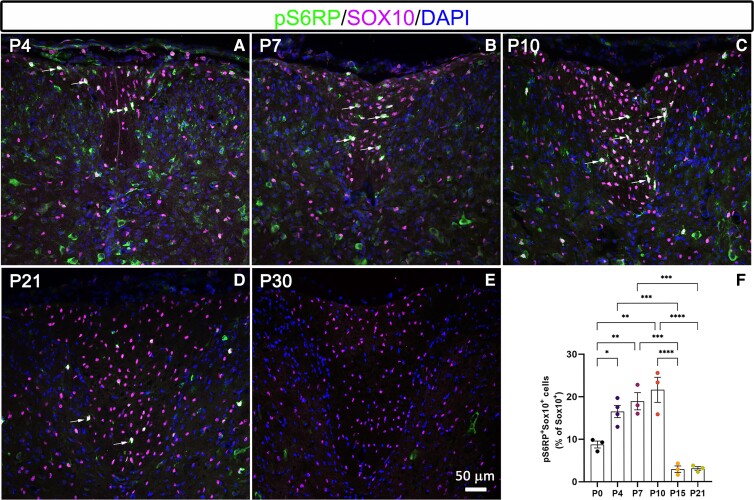
Developmental expression profile of pS6RP in oligodendroglial cells. (AE) Co-immunolabelling of pS6RP and Sox10 at PND 4 (A), PND 7 (B), PND 10 (C), PND 21 (D) and PND 30 (E) in the spinal cord. Double-positive cells are indicated by arrows. (F) Quantification of pS6RP+Sox10+ cells shows a peak of pS6RP expression between PND7 and PND10, indicating that pS6RP expression is regulated in oligodendroglial cells during development. Data represent mean ± SEM; N = 3 independent experiments for each developmental stage. ANOVA followed with post hoc Tukey's pairwise multiple comparison tests: *P < 0.05; **P < 0.01; ***P ≤ 0.001; ****P ≤ 0.0001. Panels (AE) are counterstained with DAPI. Scale bar (AE): 50 µm.

Acknowledgments
This image is the copyrighted work of the attributed author or publisher, and ZFIN has permission only to display this image to its users. Additional permissions should be obtained from the applicable author or publisher of the image. Full text @ Brain Commun