
Image
|
Figure Caption
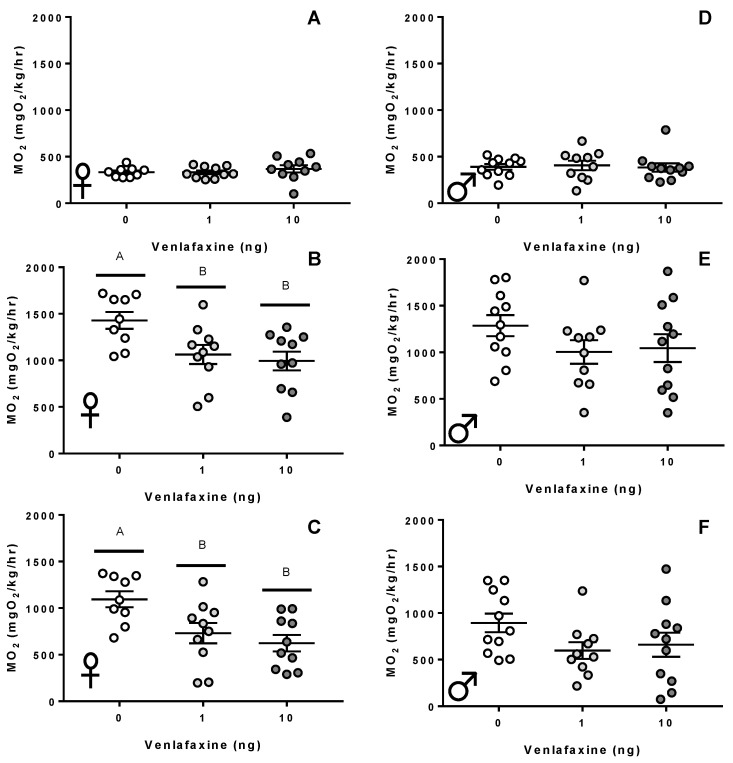
Figure 2 Metabolic rate. (A,D) Resting metabolic rate, (B,E) active metabolic rate, (C,F) the aerobic scope of 10–12 month old female (A–C) and male (D–F) zebrafish exposed to either 0, 1, or 10 ng venlafaxine at the 1–4 cell stage (n = 10–15 for respiration measurements). Different letters denote significant differences between groups. Individual data points and mean are shown for each graph (±S.E.M).
Acknowledgments
This image is the copyrighted work of the attributed author or publisher, and
ZFIN has permission only to display this image to its users.
Additional permissions should be obtained from the applicable author or publisher of the image.
Full text @ Biology (Basel)