IMAGE

Fig. 5

ID
ZDB-IMAGE-220219-19
Source
Figures for Zhang et al., 2022
Image
Figure Caption

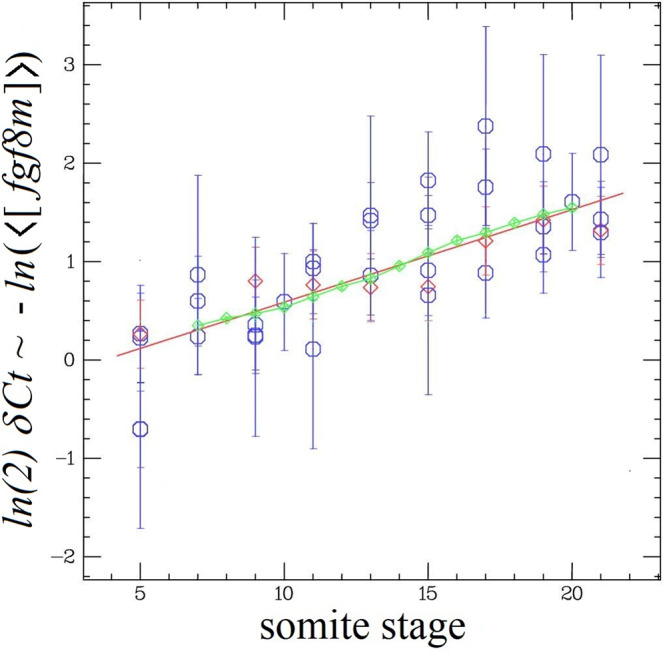
Fig. 5 Variation of the fgf8 mRNA concentration with somite stage.

Negative ln(<[fgf8m]>) (=ln(2) δCt values from the RTqPCR data) at different somitic stages (blue ○: whole embryo; red ◊ : PSM only). Red line: linear best fit (y = ax + b) with a = 0.094 ± 0.013 (Χ2= 22; DF = 36), corresponding to a an exponential decrease of <[fgf8m]> with a time constant τ = 1/a ≅ 11 somitic periods, Eq. (1). Green ◊: -ΔPSM/λ with λ = 260 μm and the PSM shrinkage, ΔPSM, taken from Fig. 4e. From the value of λ and τ we deduce a mean velocity: VPSM = λ/τ ≅ 24 μm/somite.

Acknowledgments
This image is the copyrighted work of the attributed author or publisher, and ZFIN has permission only to display this image to its users. Additional permissions should be obtained from the applicable author or publisher of the image. Full text @ Commun Biol